By Thea Pajunen
Our latest updates focus on visibility, customization, and saving you time. With new peer benchmarking for variable pay, historical tracking, reorganized reports, and smarter prompts before locking in approvals, you can compare performance with confidence, customize key documents to fit your needs, and catch important details before they’re out of reach.
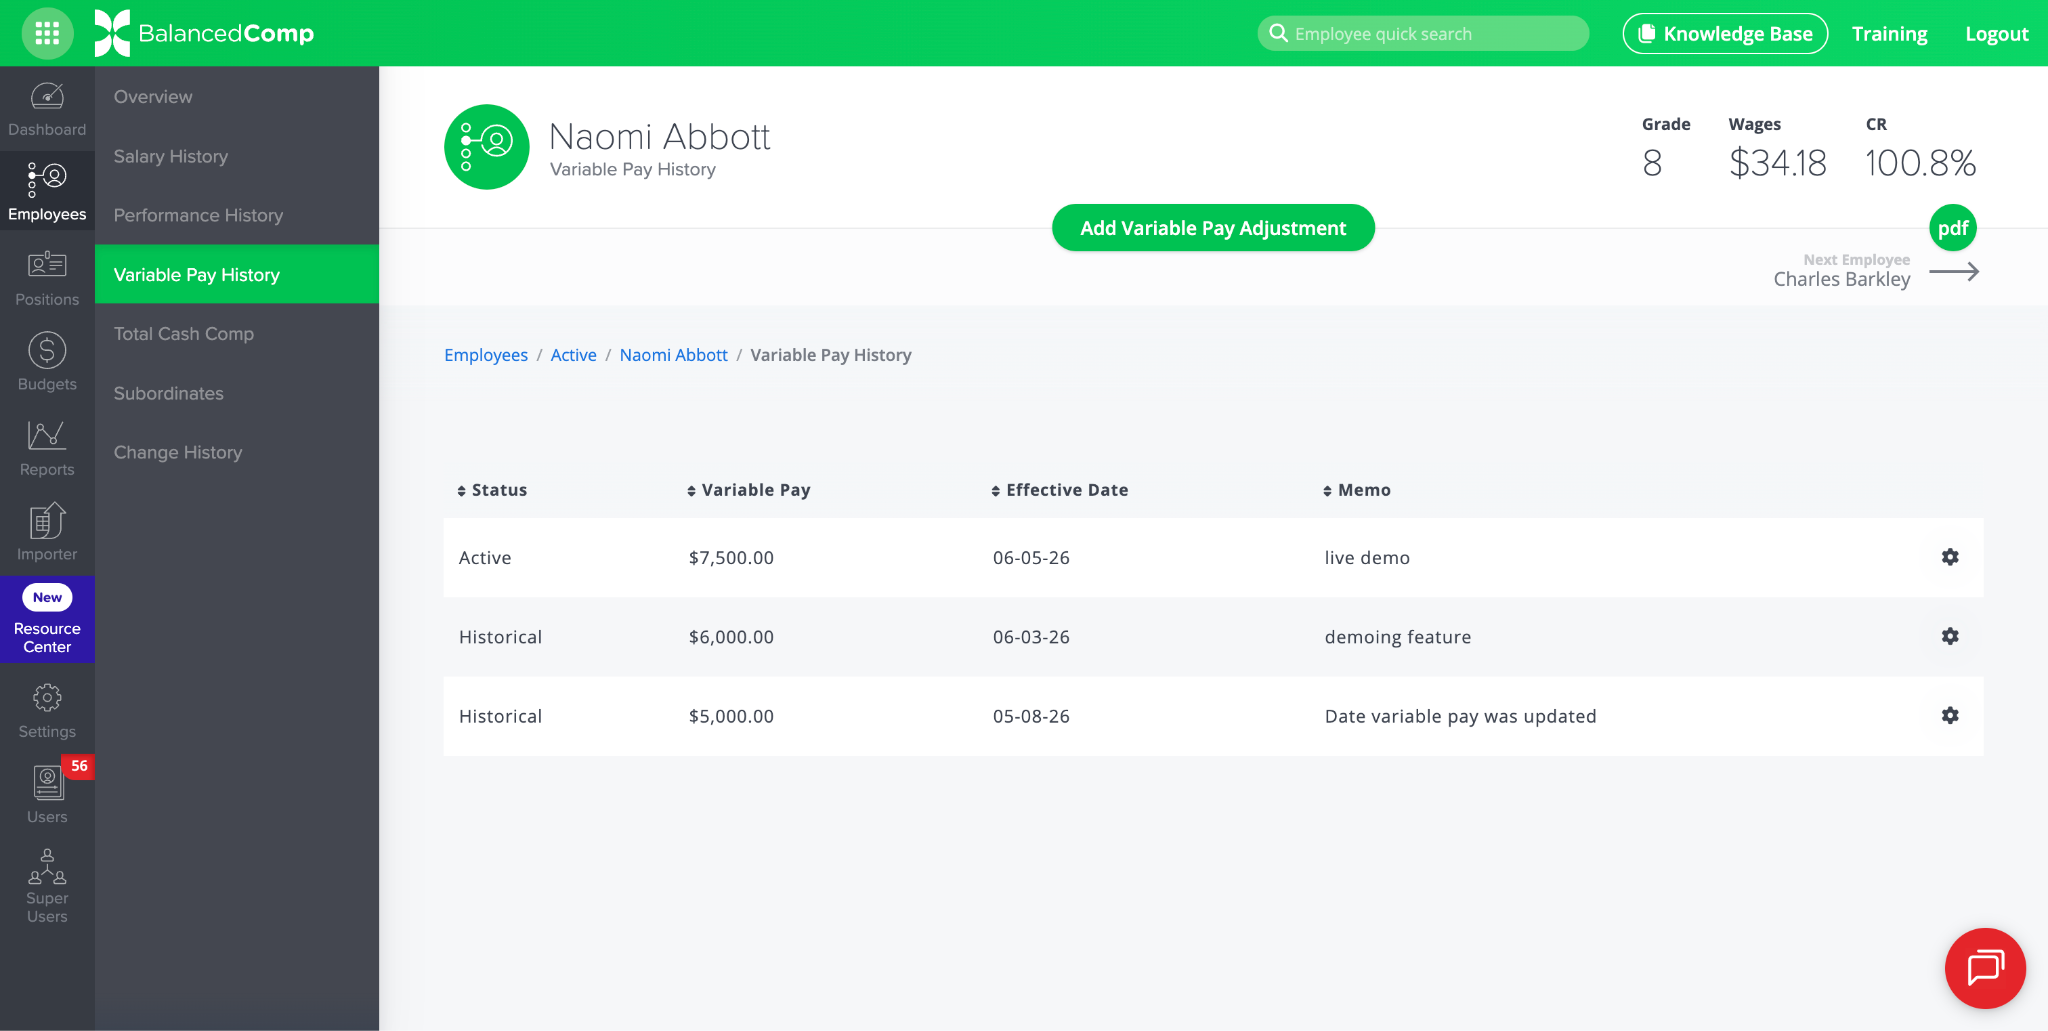
IMPROVED: Variable Pay Now Tracked Over Time
Previously, an employee’s variable pay was a single number that was overwritten whenever it changed in BalancedComp. Now, like salary and performance level adjustments, variable pay keeps a full history. This improvement provides you with a clear paper trail and visibility into which records are most current.
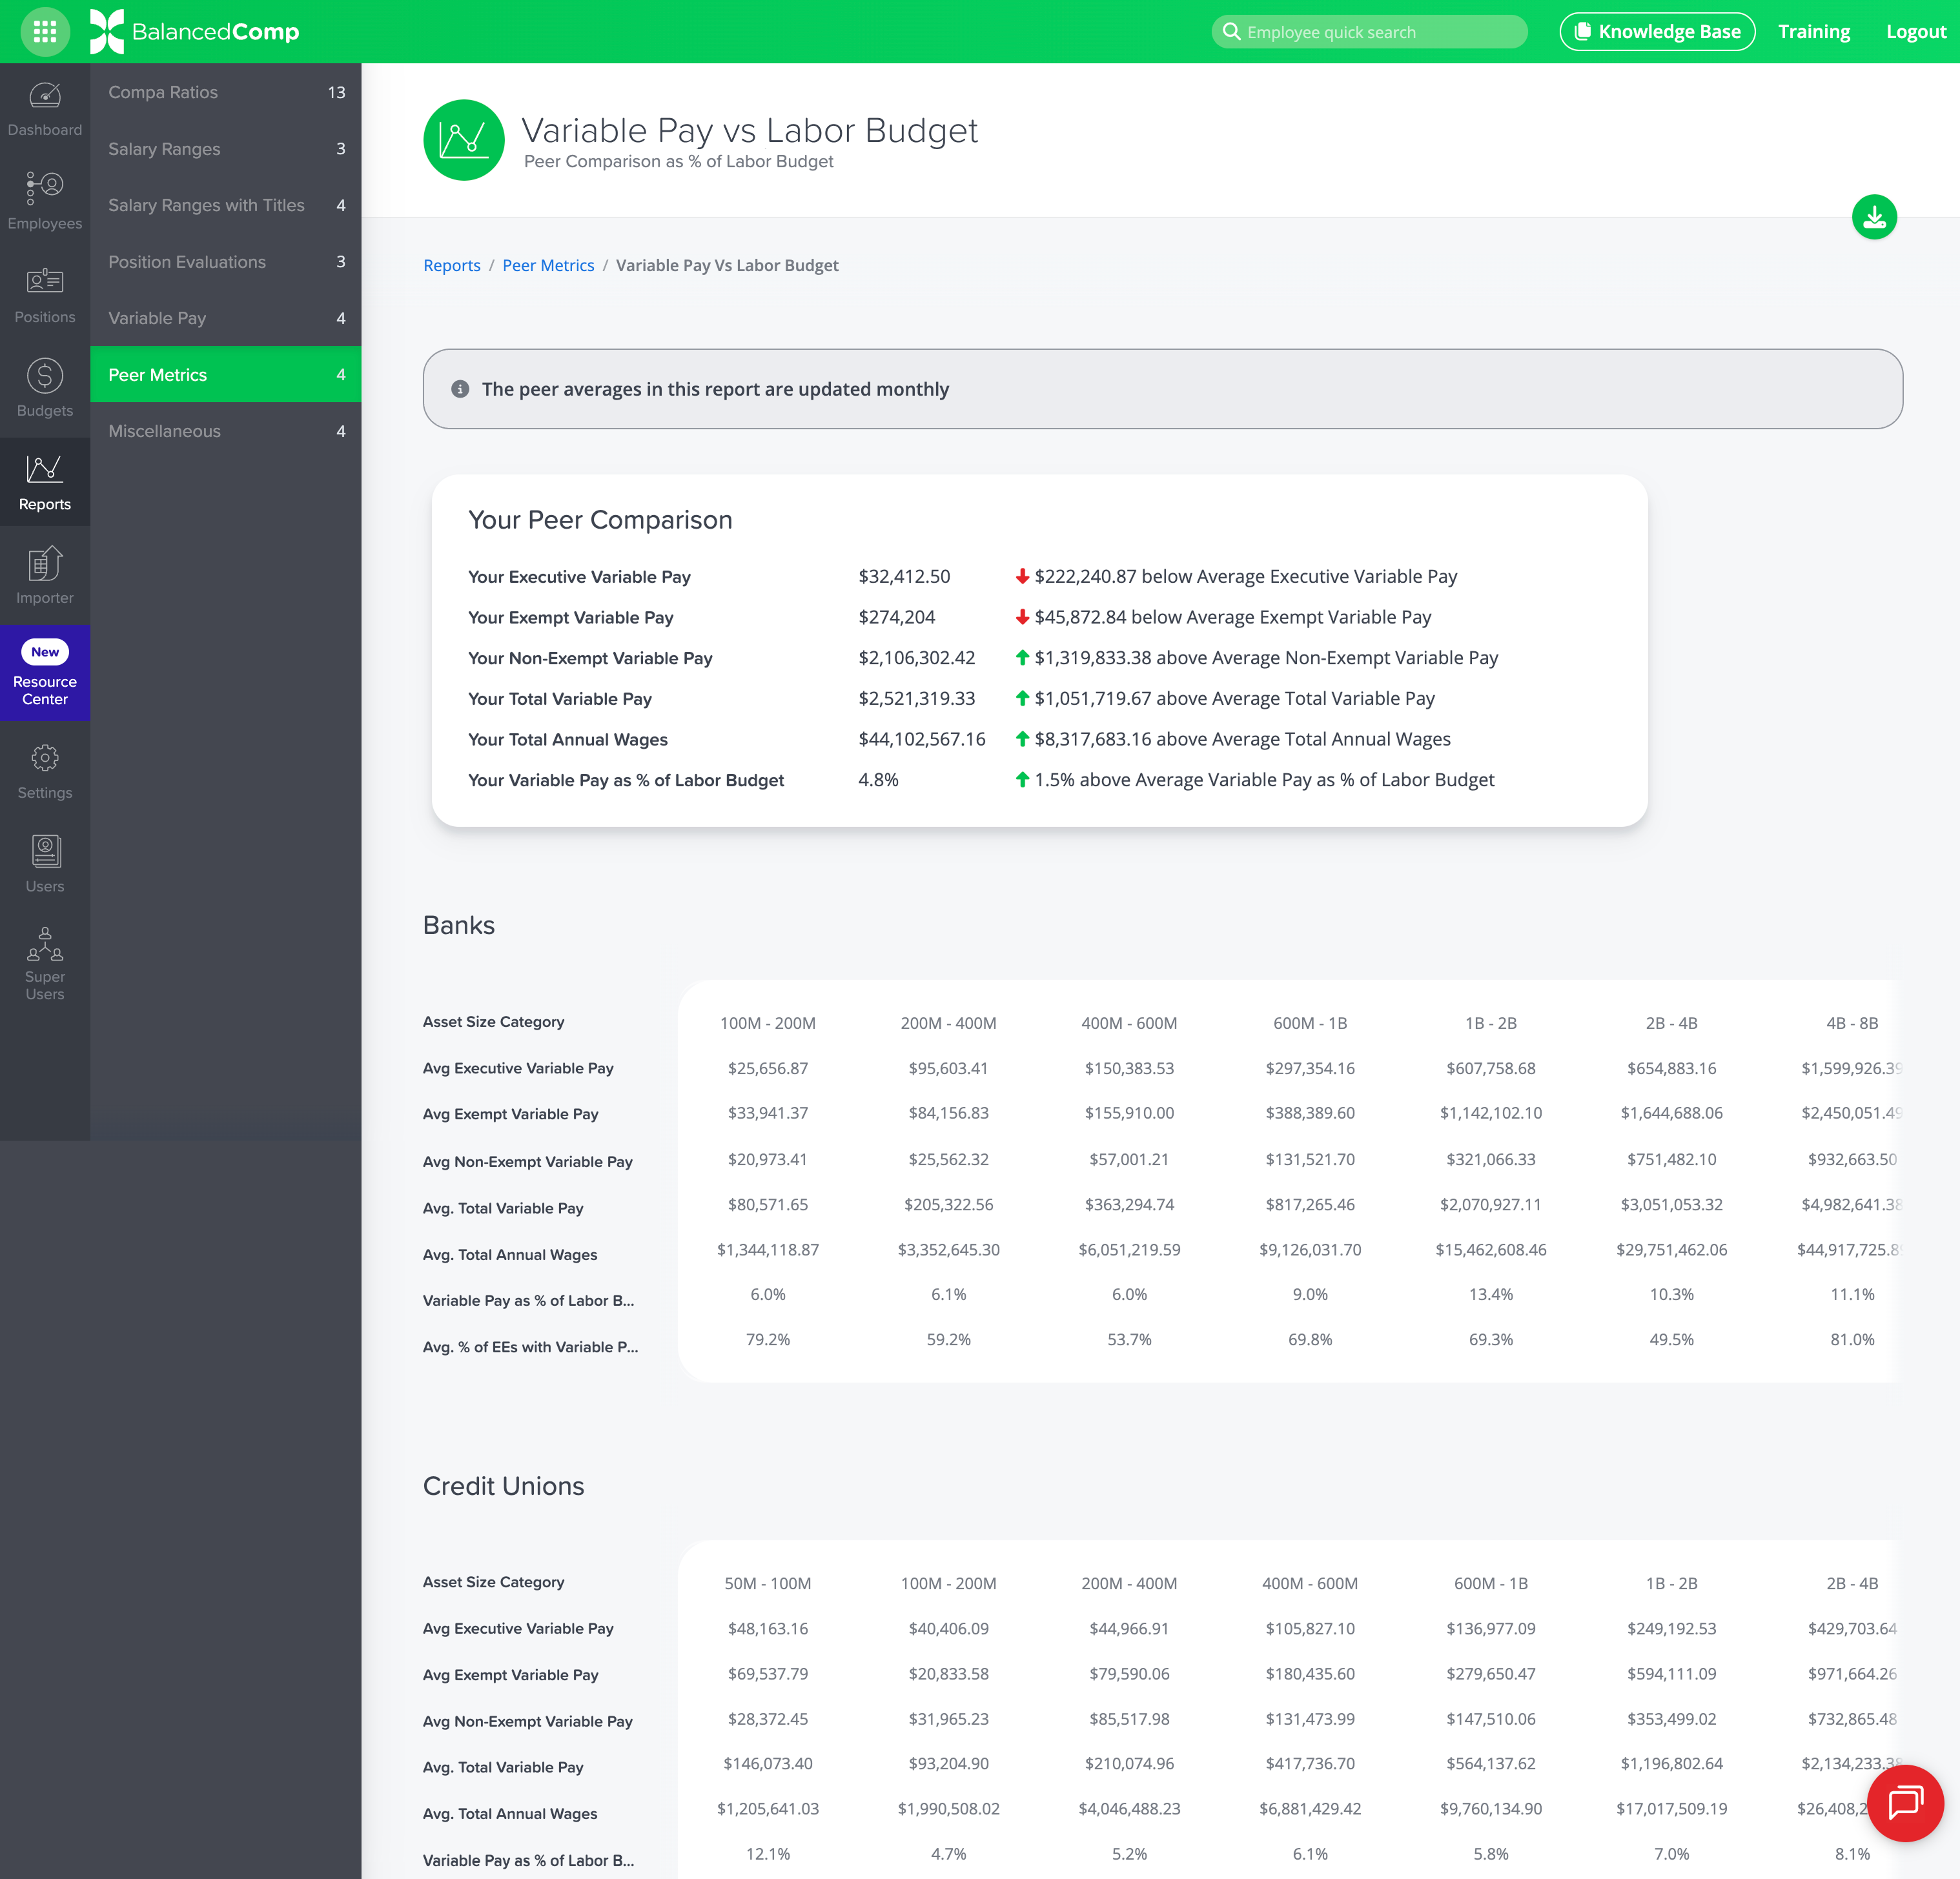
NEW: Variable Pay vs Labor Budget Report
This report shows how your variable pay compares to other BalancedComp clients of similar asset size. You’ll see your own Executive, Exempt, Non-Exempt, and Total Variable Pay alongside peer averages. You can also see how your variable pay stacks up as a percentage of the labor budget. Peer averages are updated monthly and broken out by asset size category for both banks and credit unions.
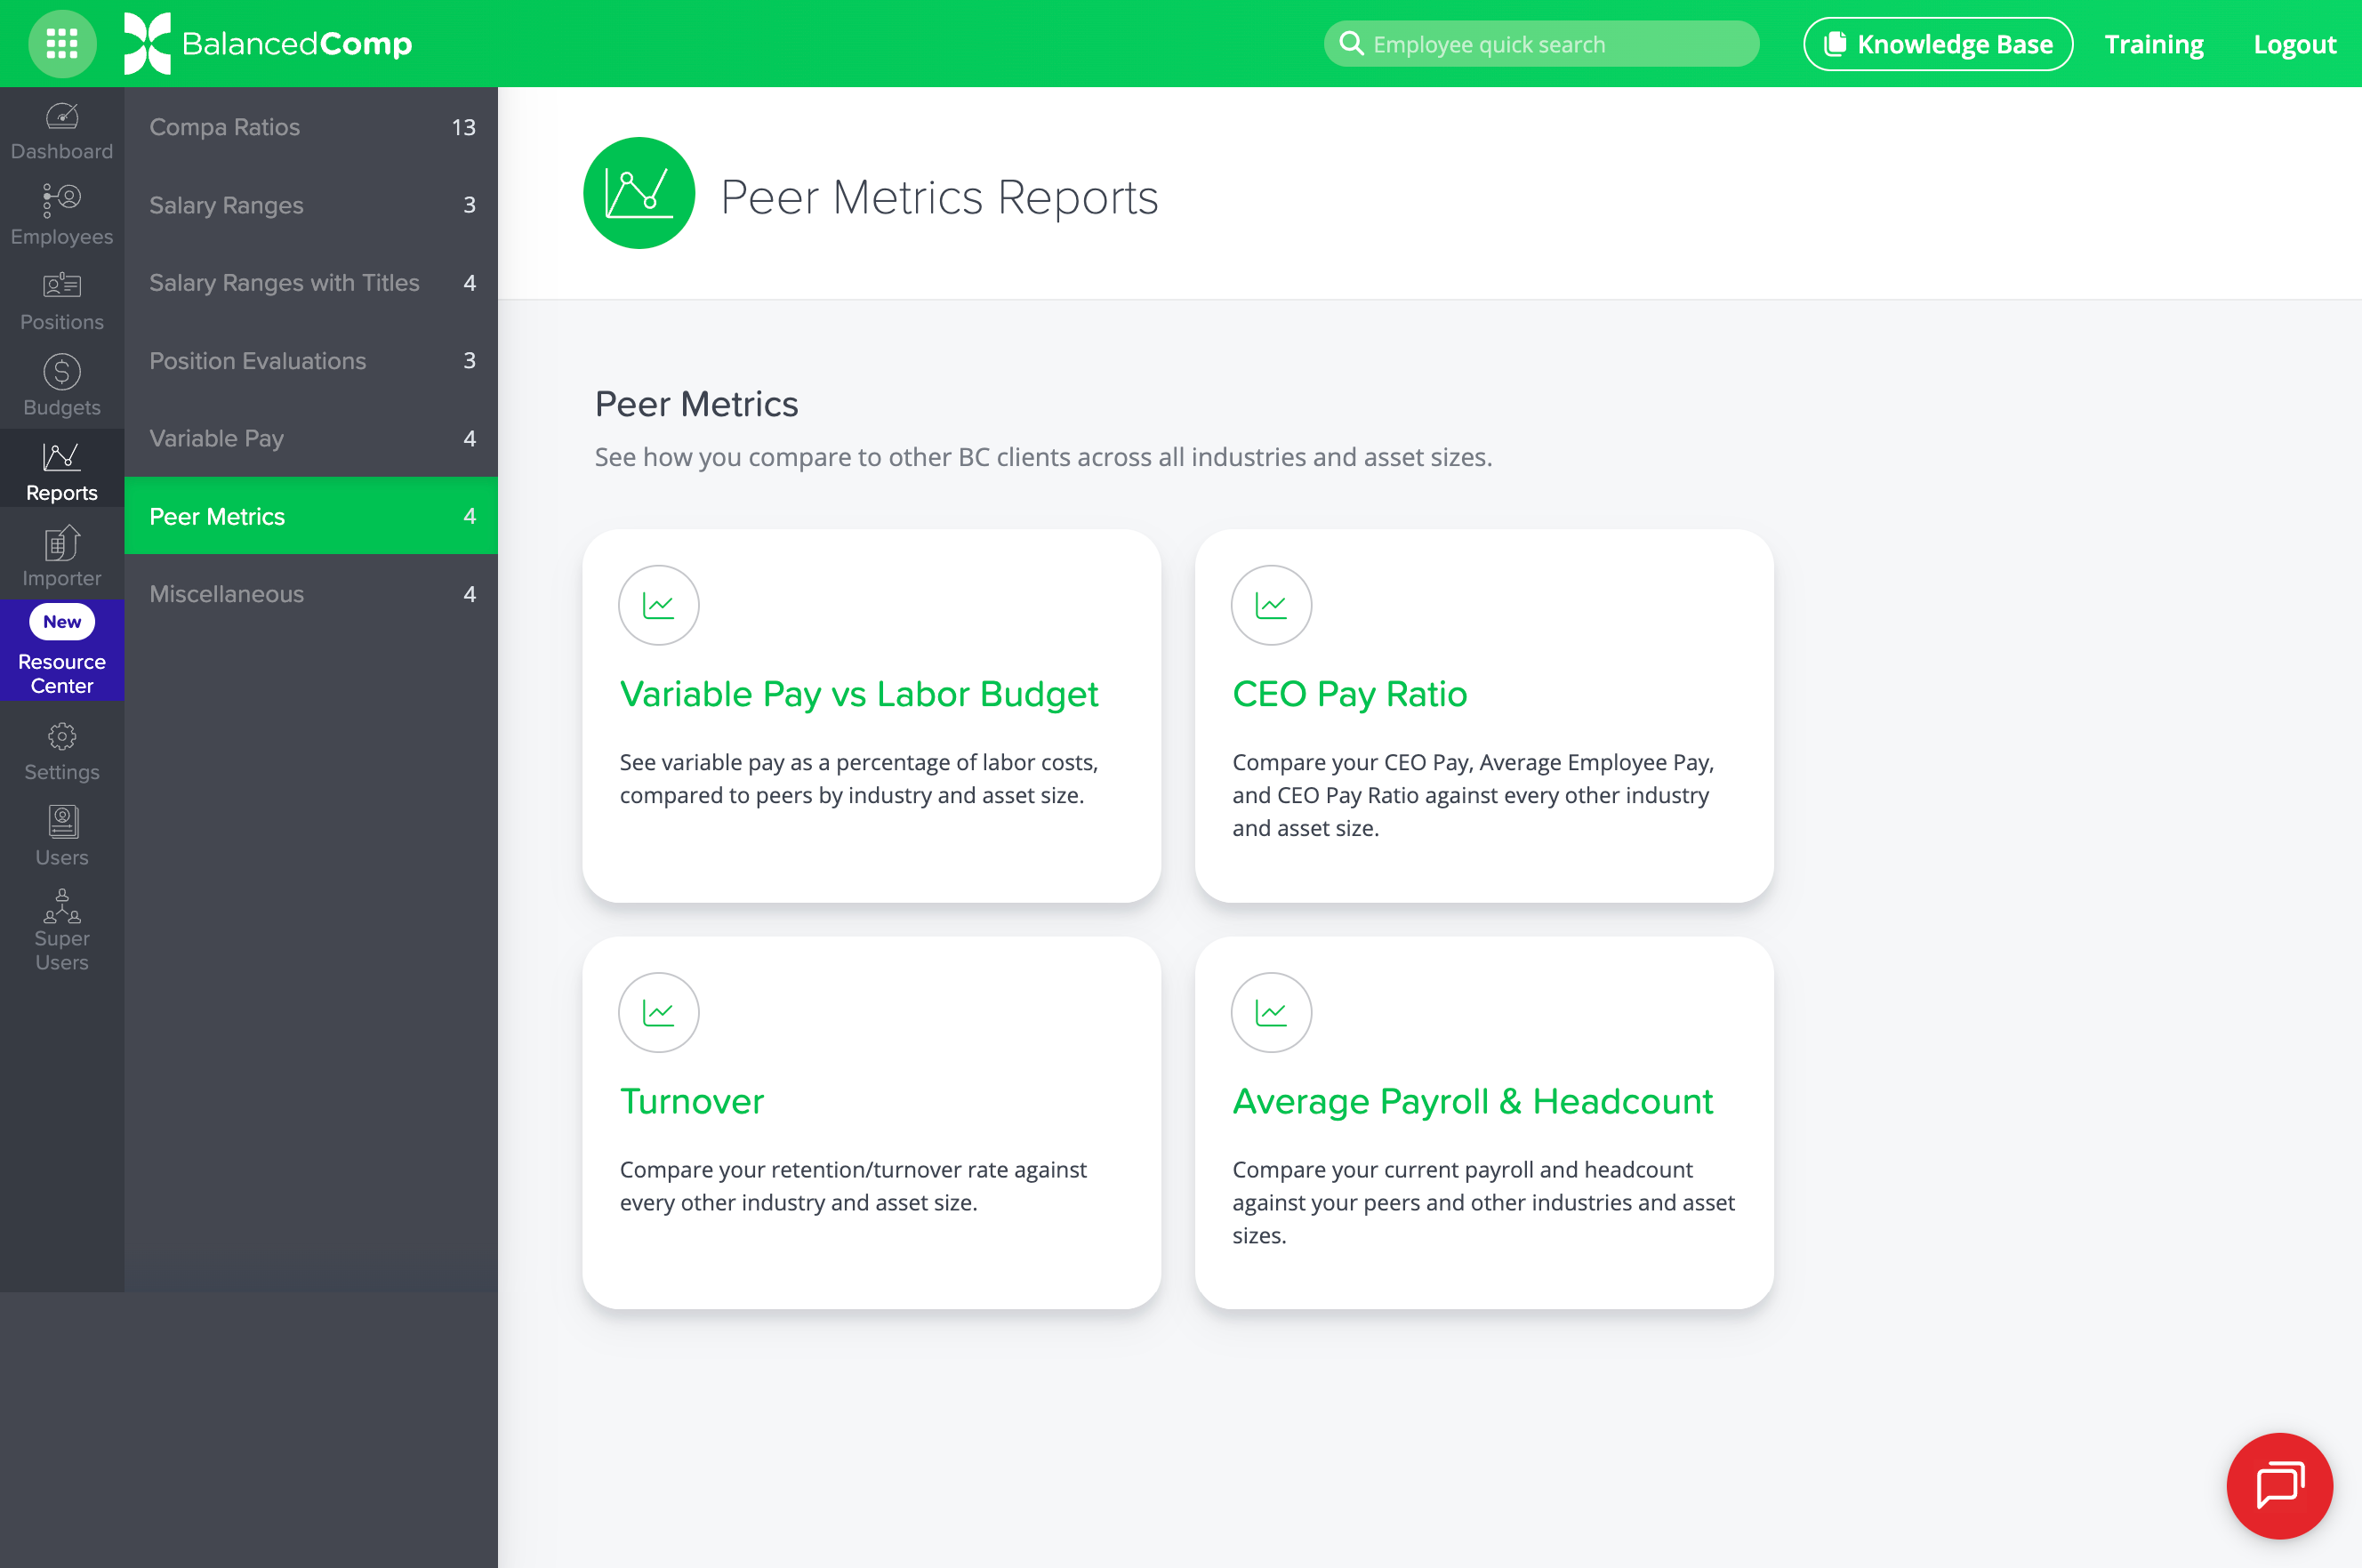
IMPROVED: Reports Reorganized Under Peer Metrics
Over the past few years, we’ve added several reports that benchmark your performance against other BalancedComp clients across industries and asset sizes. These reports had been sitting in the Miscellaneous section by default, but have recently moved to the Peer Metrics section under Reports and include the following:
- Variable Pay vs. Labor Budget Report
- CEO Pay Ratio Report
- Turnover Report
- Average Payroll & Headcount Report
If they haven’t checked these out yet, now is a great time.
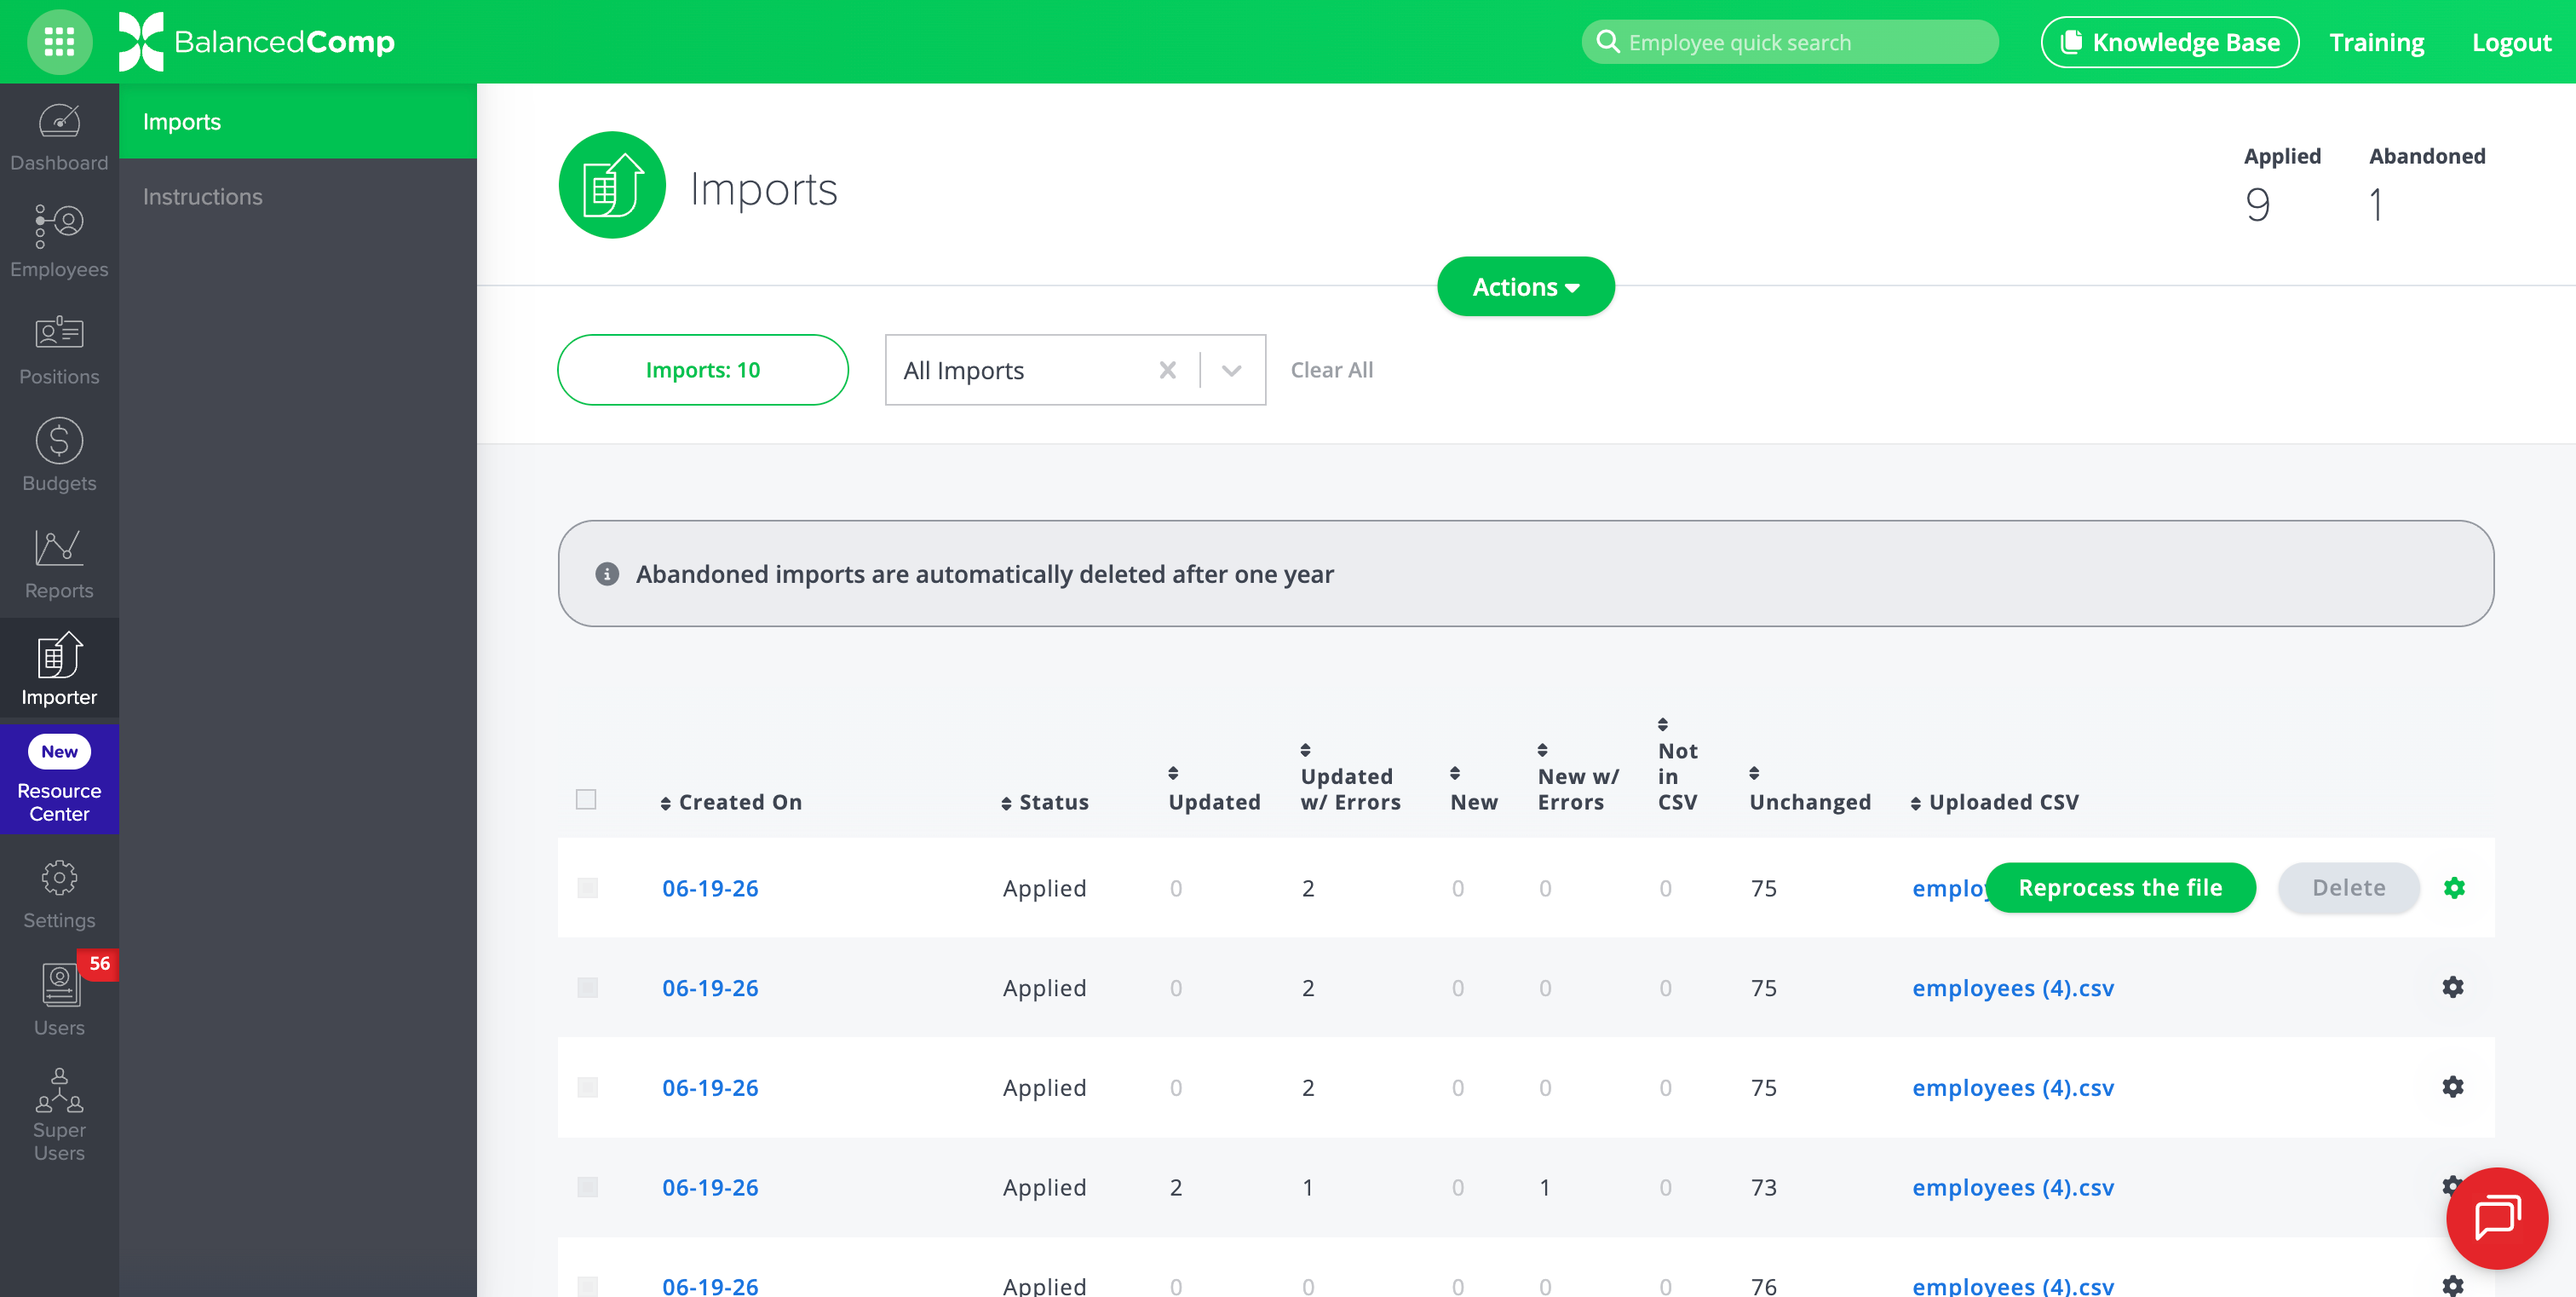
NEW: Ability to Reprocess an Import File
As we prepare to integrate BalancedComp with payroll systems, we have added the time-saving ability to reprocess your most recently imported file. Instead of the previous process, which required re-uploading the same file, rematching column headers, etc., you can now simply reprocess the file instantly.
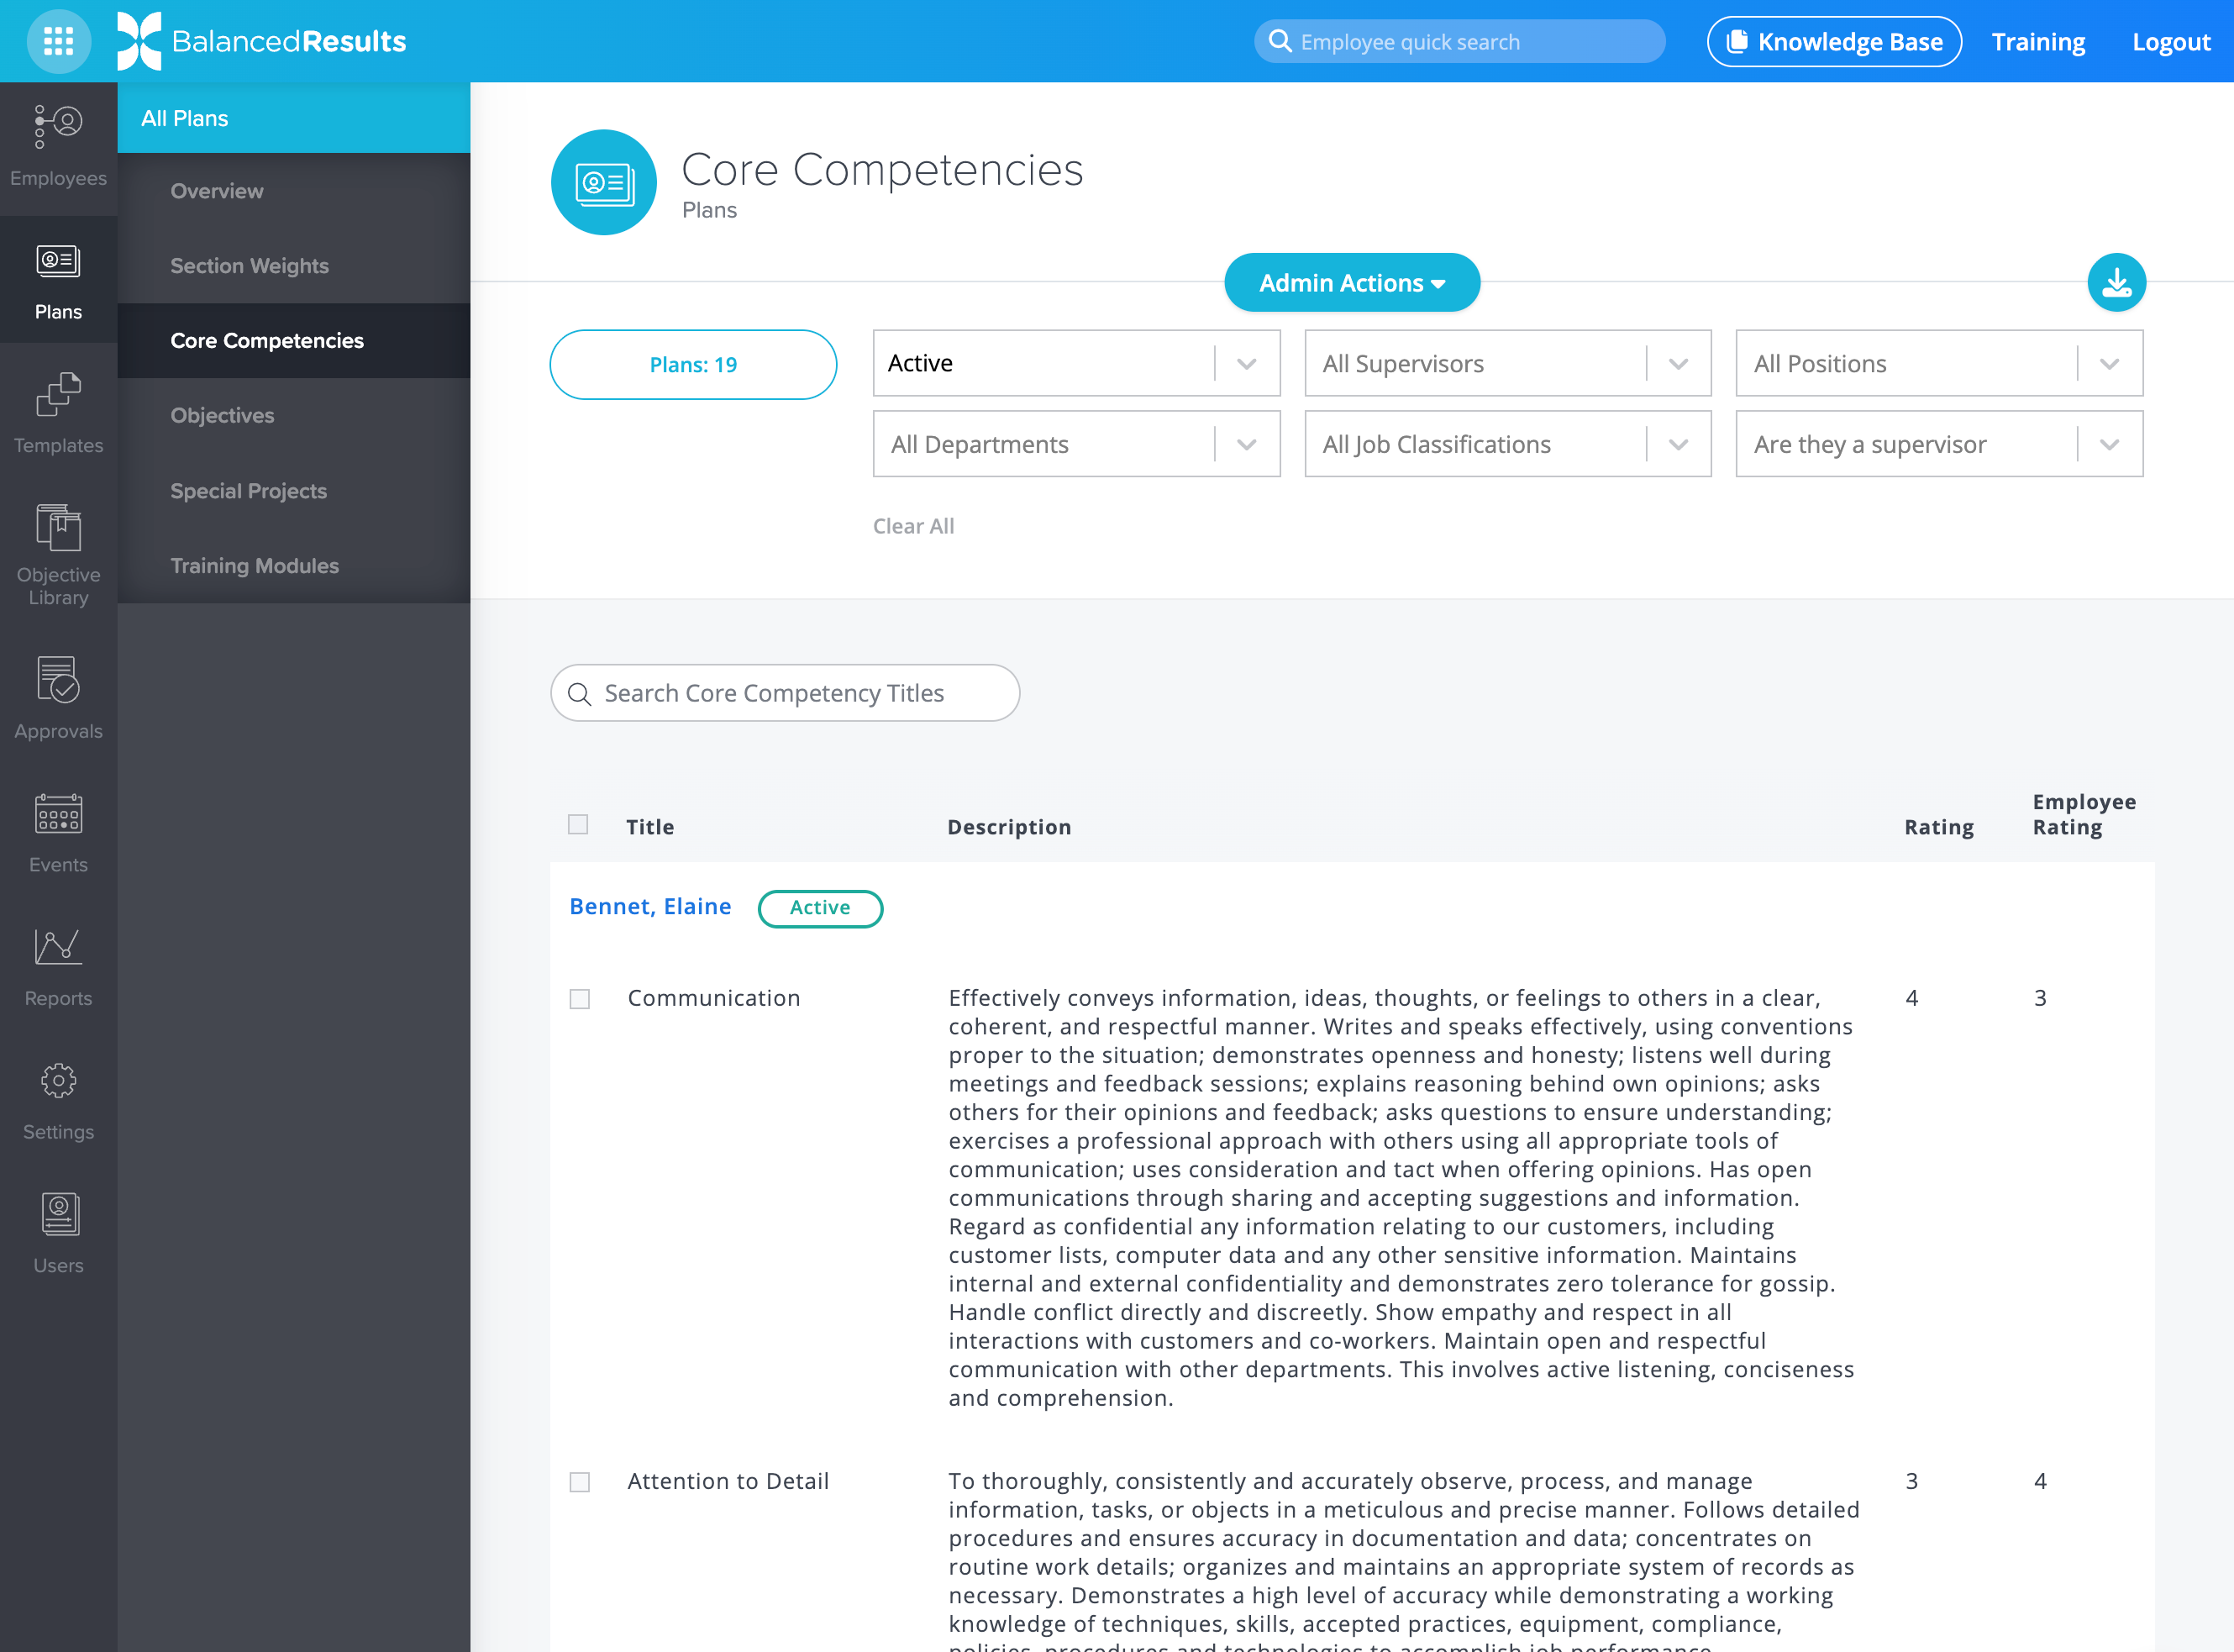
IMPROVED: Incoming Scores and Ratings Added to Plan Indexes
The recently added Plans Overview index in BalancedResults provides a high-level view of core competencies, objectives, special projects, and training modules. We’ve expanded these overviews to include scores and ratings. This lets you evaluate how employees are performing as their scores come in, rather than just reviewing plan content.
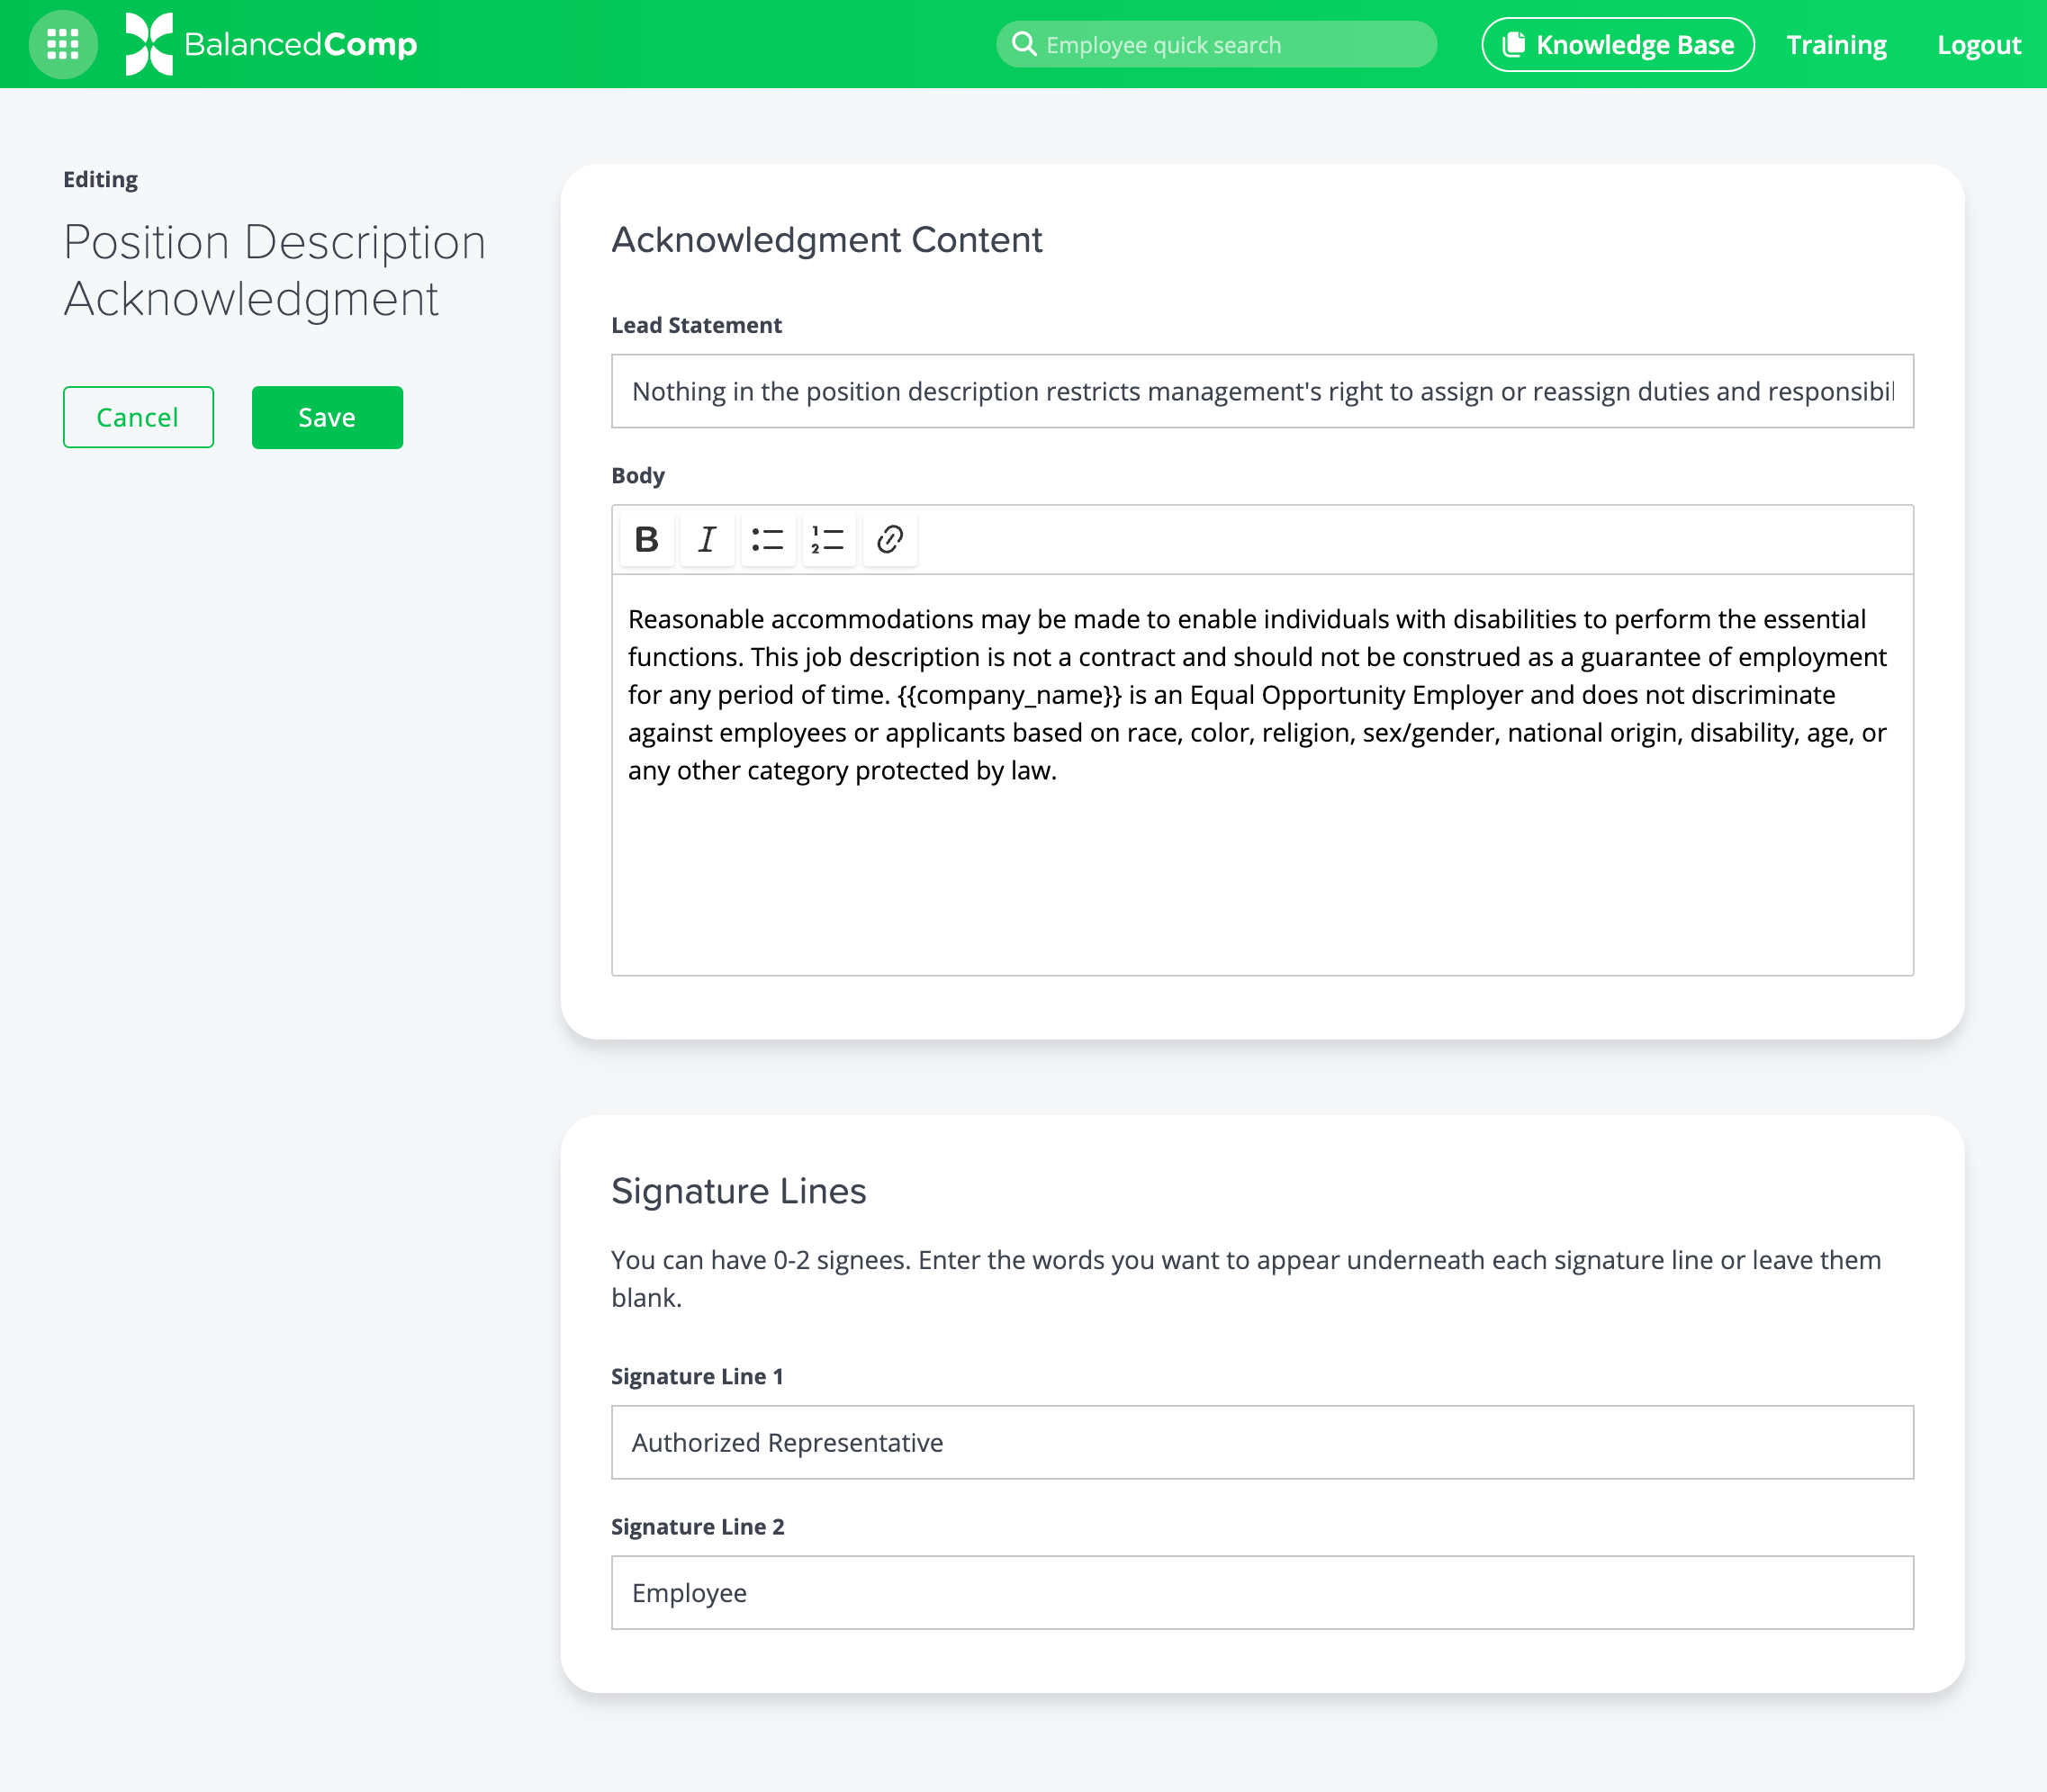
NEW: Ability to Customize the Signature Lines of Job Descriptions
When you print or export a job description as a PDF in BalancedComp, you’ve probably noticed the acknowledgment and signature lines that appear at the bottom of each PDF. You can now customize this acknowledgment to include any language or requirements your company needs.
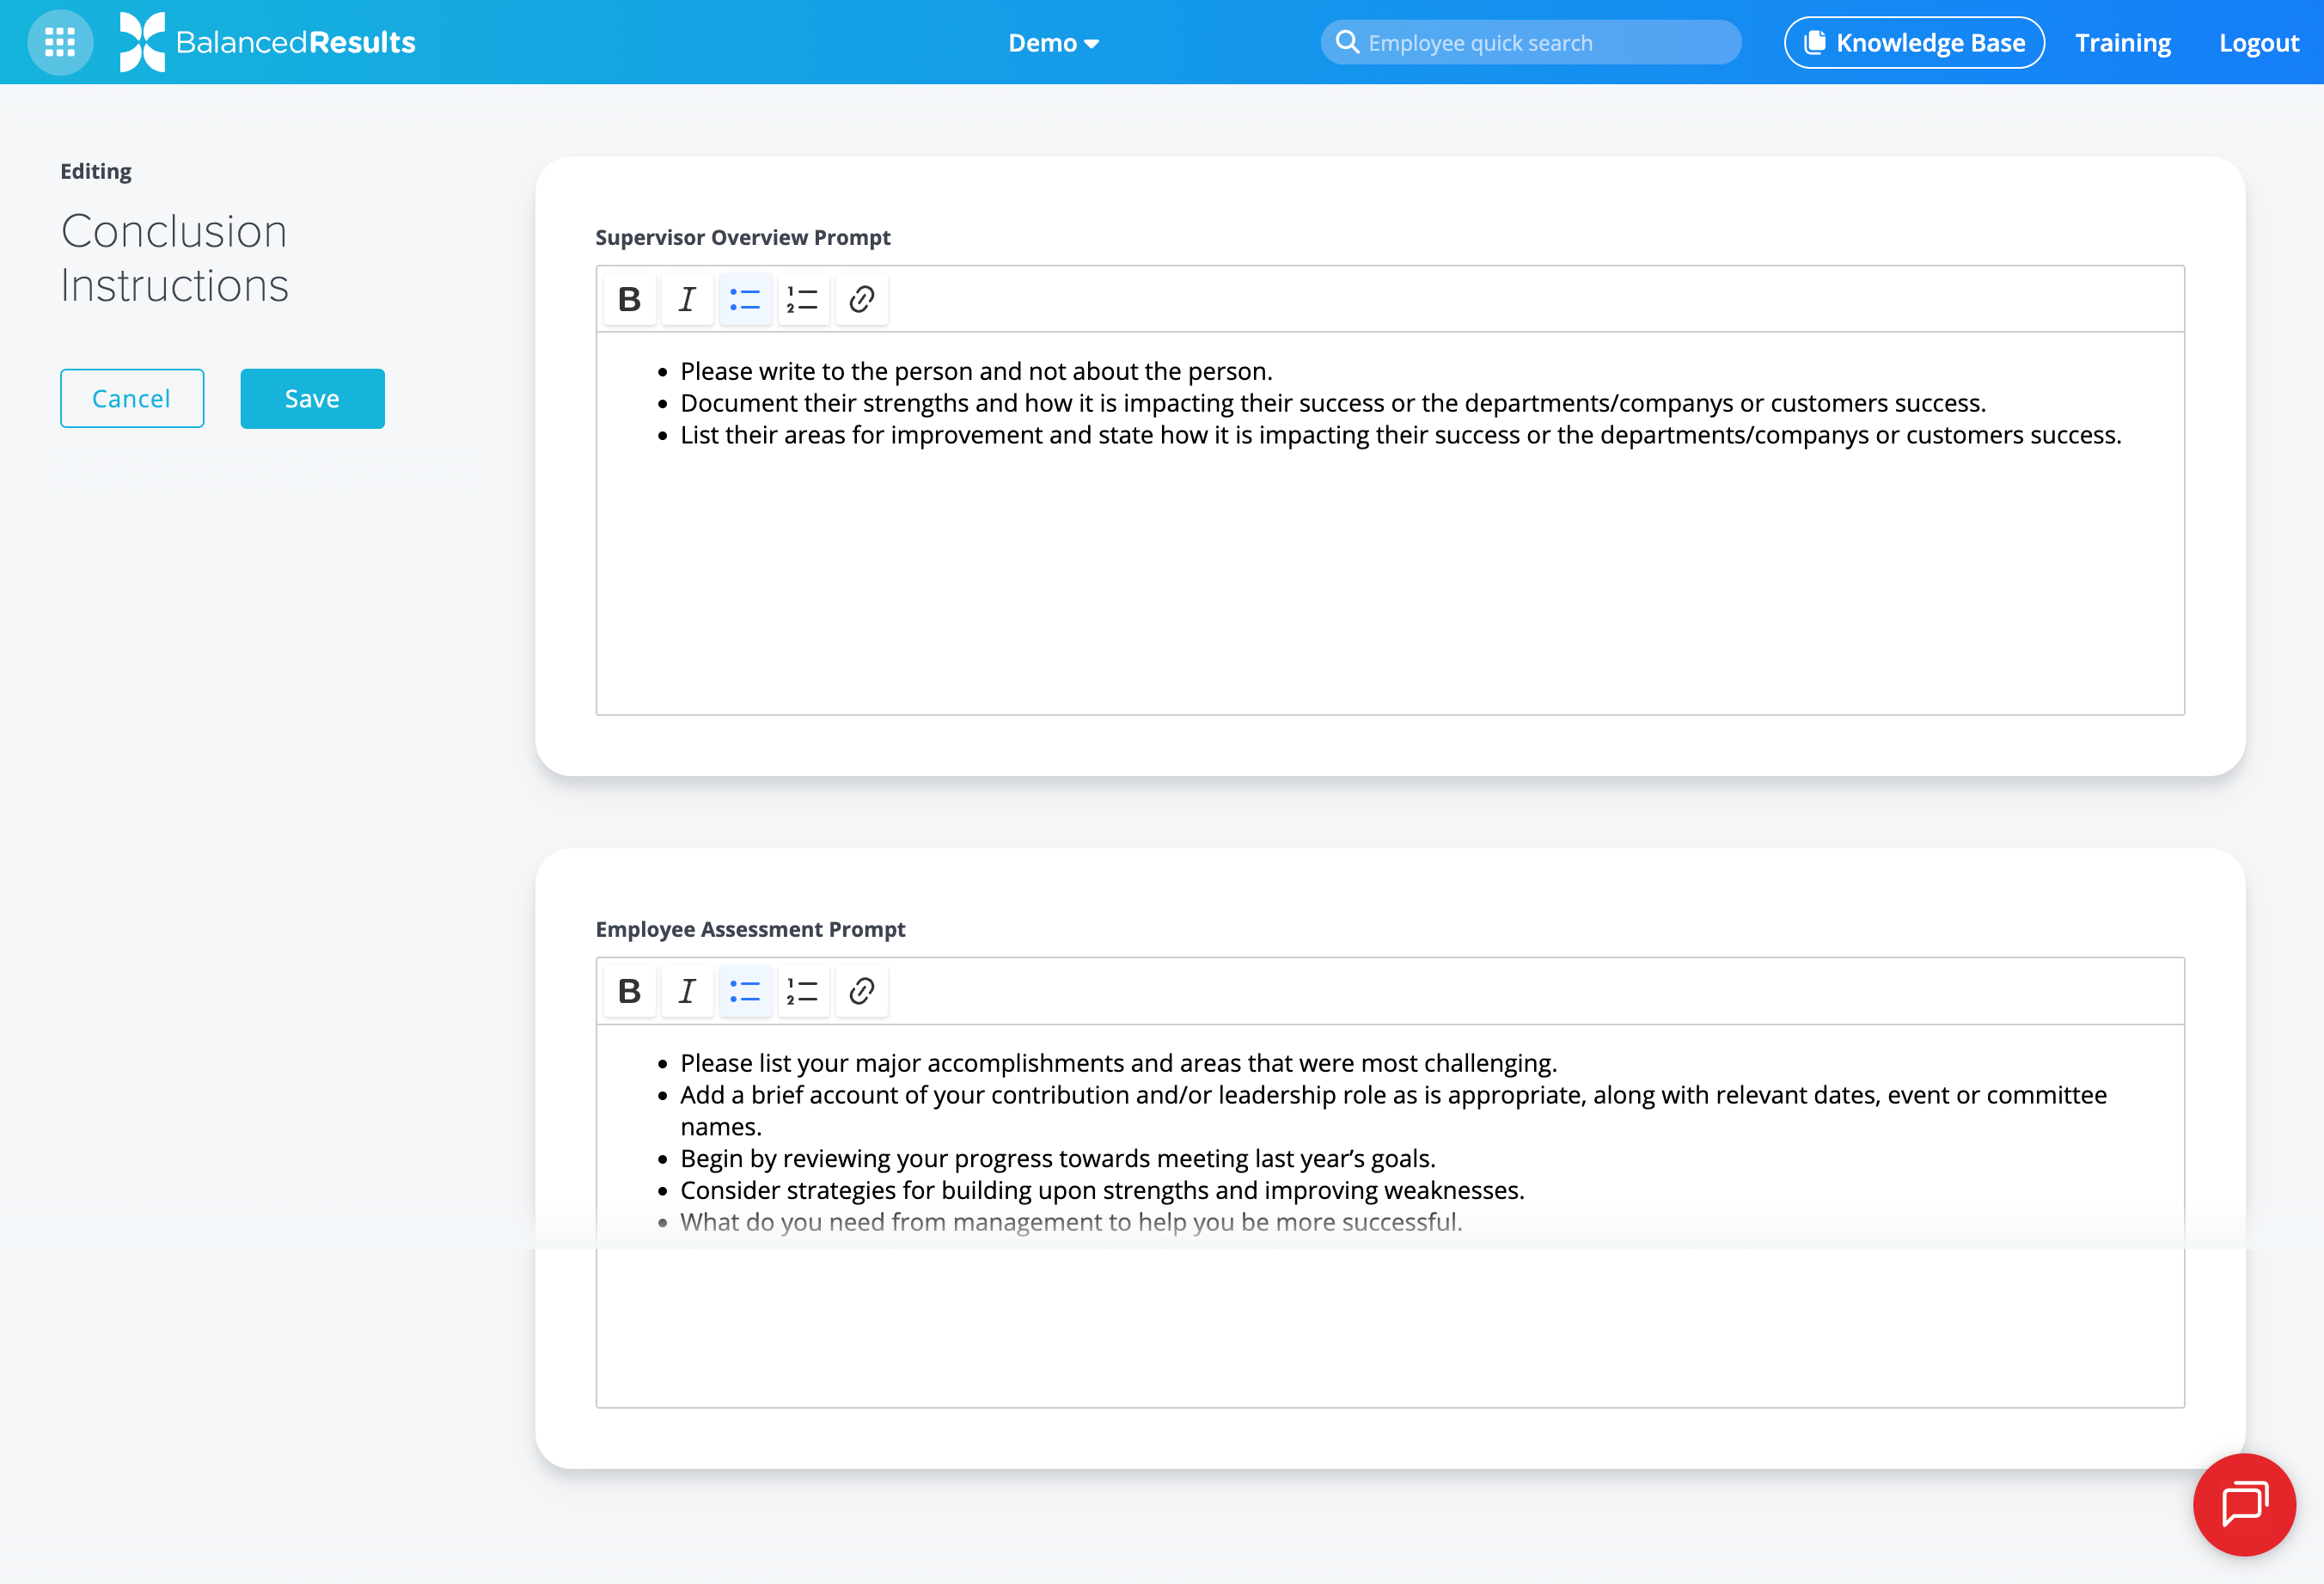
IMPROVED: Additional Text Formatting Capabilities for Conclusion Instructions
While Admins have always been able to set up conclusion instructions in BalancedResults for both supervisors and employees, they haven’t been able to do much text formatting. We’ve improved that feature by adding a full WYSIWYG (What You See Is What You Get) editor to help refine the formatting of your instructions, including bullets, bold text, hyperlinks, and more.
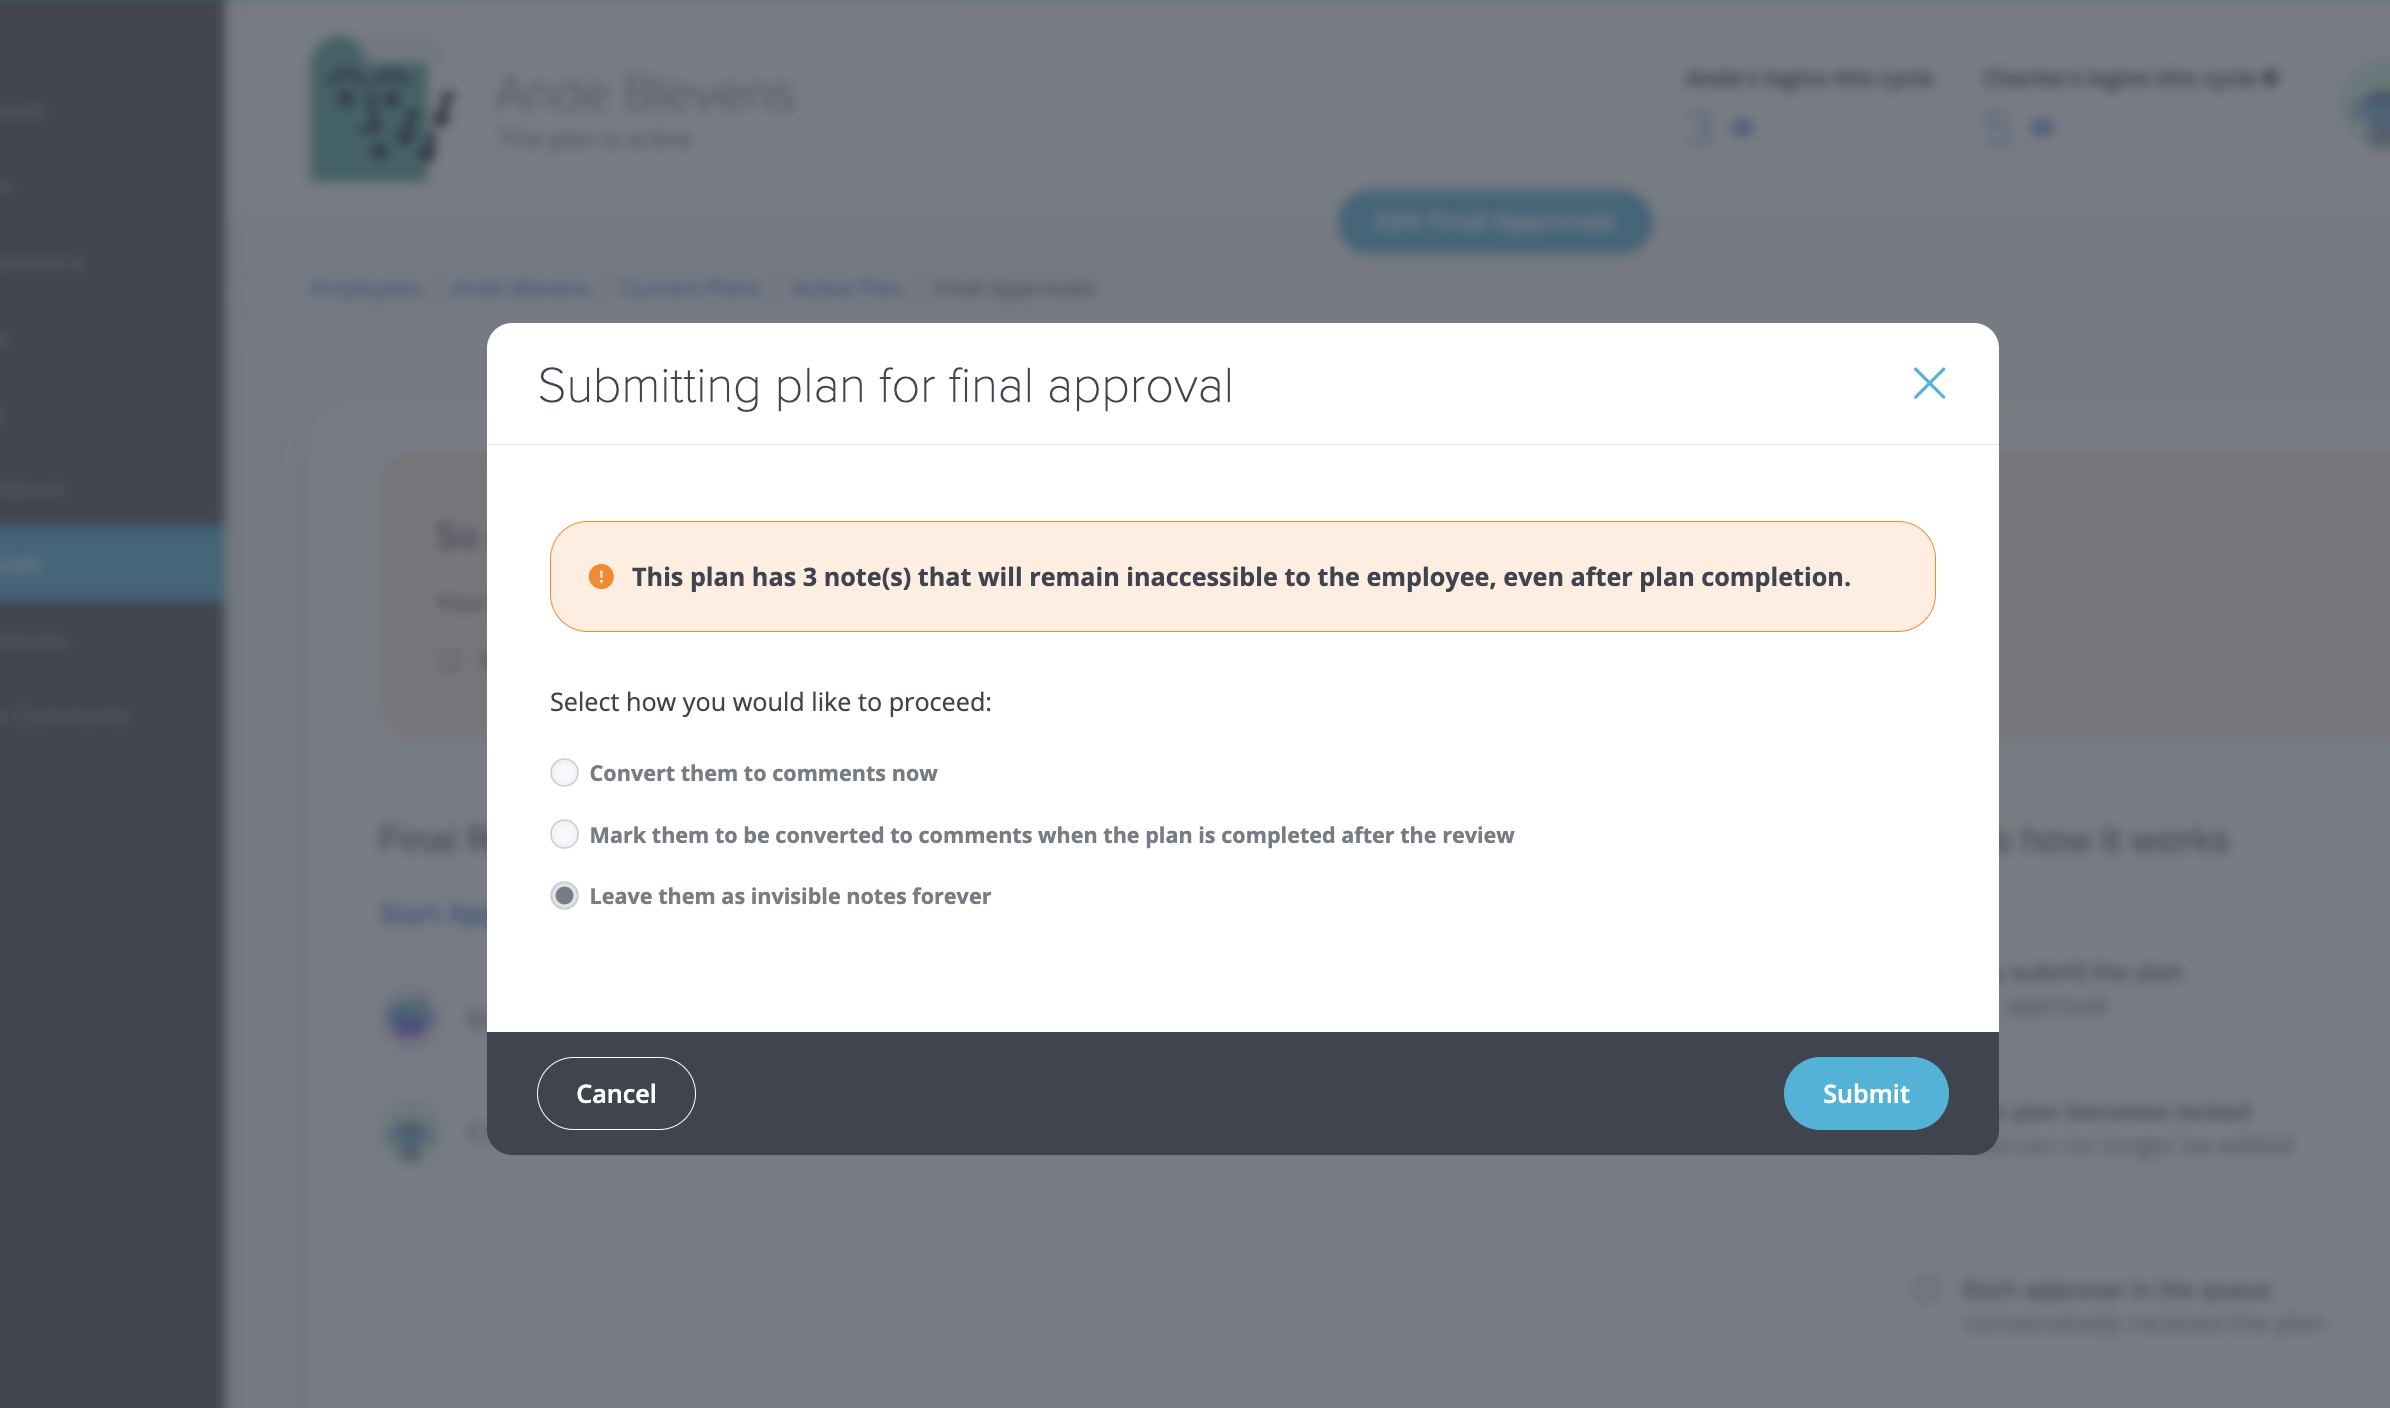
NEW: Unseen Notes Warning When Submitting a Plan for Final Approval
When a supervisor submits a plan for final approval in BalancedResults, it locks, meaning that any notes not marked to be converted into comments are permanently hidden from the employee. A new prompt now alerts supervisors to see how many notes will go unseen before they finalize their submission, and gives them an opportunity to convert them all to comments in one easy step.
Back to Blog