By Christie Summervill

As of mid-summer 2022, over 11 million U.S. jobs have remained open, according to CNBC. In a recent SHRM report, 93 percent of executives reported having open positions at their companies for six months or longer, and this can lead to burnout amongst all levels of staff. Using the wrong merit increase matrix to determine 2023 salary increases will likely be disastrous for your recruiting efforts and ultimately hurt your organization’s bottom line. With a record-high 9.25% inflation rate trending towards an 8.5% rate until at least Q4 2023, next year’s labor market is almost guaranteed to continue to be devastatingly challenging to recruit. Don’t worry; we are here to help you navigate these turbulent times.
The average projected salary structure movement (from the 2022 midpoint to the 2023 midpoint) is around 3.5%. The average labor budget is projected to be 5.0%. A typically 3.5% salary increase would mean employee pay levels would not move any closer to the markets’ midpoint, regardless of performance or time in position.
A potential outcome of this model would be unnecessary turnover, typically highest amongst those with less than one year of work experience. By advocating that your 2023 salary budget be increased to 5% or greater, you will reduce the amount of unnecessary turnover and help ensure that those you would likely promote one year later into other positions will still be onboard. Even with that adjustment, this leaves you with a 1.5% variable for performance differentials and movement in the range. Your base salaries should budget for 1% in a separate budget for promotions.
When developing an effective labor budget matrix, keep your eye on the percentage where “Meets Expectation” intersects with the “Market Rate Compa Ratio” (between 97% – 103%). In 2023, that number is at 3.5%. Consider how much of a salary increase your top-rated performers should receive over your “Meets Expectations” rated performers. If the difference between these classes of employees is at 1%, then you are essentially saying “performance does not pay here,” which may lead to higher turnover or a disenfranchised workforce. You must account for this when preparing your workforce budget for next year.
Ideally, your range of performance classes should be at least a 2% difference to account for “paying for performance” among your highest-performing employees. Doing so ensures that higher-performing employees’ pay levels move closer to the midpoint more quickly, thereby protecting them from a need to have conversations with tempting recruiters. To create a proper pay-for-performance practice, you should be a 2% difference between the salary increase your top performers receive and your “meets expectations” performers. This also ensures that the pay levels of higher performing employees move closer to the midpoint more quickly, thereby protecting them from a need to have a conversation with tempting recruiters. Too often, those whose managers are willing to go to bat for them receive a higher salary increase.
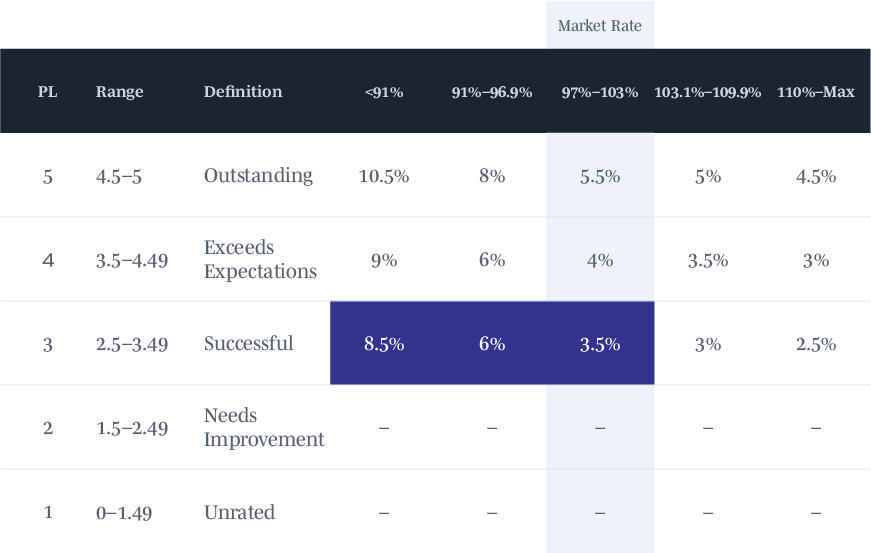
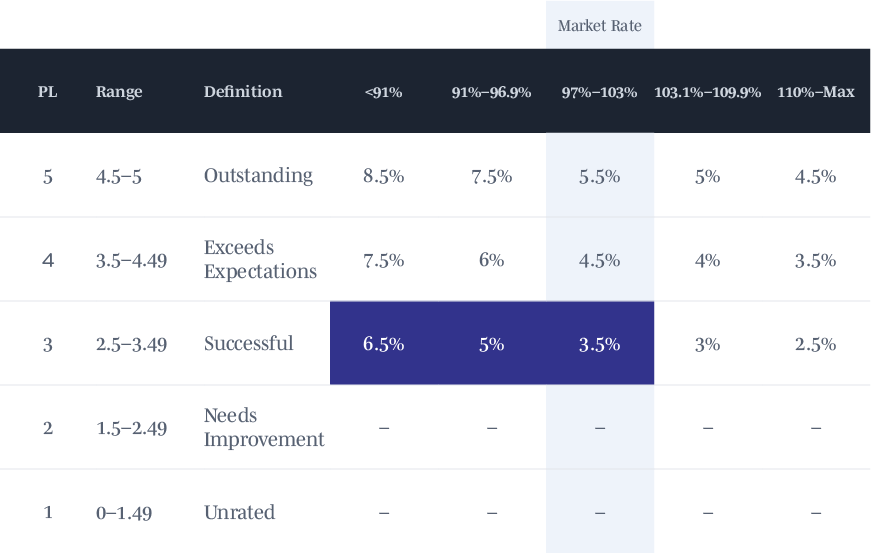
If you have a non-exempt employee new to the company or position, their compa ratio should be at least 85% of the midpoint. The same will apply to executives if the company has recently moved its peer comparison group to a larger asset size. By having a starting pay at 80% of the midpoint, you are in essence saying, “these employees can replace their salaries at the drop of a hat, and we are ok with that.” With this in mind, you need an additional 5% over the 3.5% so that their pay level will meet the market rate expectation within three years if you are operating in a normal market. (See Matrix A). Exempt employees should reach their midpoint within five years, with their difference set at 3%. (See Matrix B).
We recommend you move the midpoints of “hot jobs” like key IT positions, Commercial Loan Officer, Information Security Officer, Senior Credit Analyst, Sr. Financial Analyst, and some hard-to-fill Compliance jobs to the 60th percentile before applying this merit increase matrix.
MATRIX A – NON-EXEMPT TO MIDPOINT IN 3 YEAR

MATRIX B – EXEMPT TO MIDPOINT IN 5 YEARS

If you cannot get approval on the above amounts, then it would be advisable to lessen the difference for performance to 1.5%. It is essential to protect the movement to midpoint for the seasoned, experienced employees you want to retain and not give them a reason to browse online job boards for other opportunities. If there was ever a time when a board should recognize the need to move pay levels to a competitive market rate, it is now! You can no longer get by with just a family-friendly work environment and a positive work culture – a good culture is a minimum expectation. HR has the opportunity to make an impact on the company’s bottom line by ensuring that your labor budget merit increase matrix is set correctly. High-performing financial institutions plan to give employees more significant raises next year as they recover from the economic fallout of the pandemic and face mounting challenges attracting and retaining employees. Adjust your merit increase matrix to ensure that your organization pays competitively to the market.
We make this process easier for our clients with our best-in-industry web-based software and our team of expert HR consultants. Our compensation and salary experts team ensures that every financial institution pays for performance while meeting the market. To learn more about our BalancedComp salary administration software, please schedule a demo today.
Back to Blog

