By Christie Summervill

“CEOs were paid 350 percent more than the average worker in 2020” – Economic Pay Watch
“CEO Pay Has Soared by Nearly 1,500% Since 1978, While Workers Have Been Left Behind” – In These Times
“The Age of Greedflation is here: See how obscene CEO-to-Worker Pay Ratios are Right Now” – FastCompany
These incendiary titles effectively stir up indignation in those who interpret this as the ultimate proof of a severe social injustice that demands a response. But is it? And if it is a social injustice issue, is this a reflection of your industry or your financial institution? And if it is relevant to your industry, how would a fair CEO Pay Ratio be determined, and who is the right authority to make this determination? Is it out of line for the Chief Executive of a successful company to be paid hundreds of times the salary of their average employee? Or is ‘CEO’ a demanding enough job, requiring such highly developed skill sets, that these high salary discrepancies are deserved? And of even more importance, is it the right focus to actually determine the correct compensation level of the CEO?
In 2010, CEO Pay Ratio requirements were passed in The Dodd-Frank Act in response to the economic crises of the late 2000s in order to avoid widespread financial collapse. Excessive executive pay was thrust into the spotlight as the hallmark of income inequality during that time because worker pay had stagnated while executive pay had soared to unprecedented heights. This section of Dodd-Frank was designed to increase compensation discrepancy transparency by requiring publicly-traded companies to publish both CEO and median worker pay figures to highlight the ratio of difference between them. By law, this data began to be shared by these publicly-traded companies in 2017 with the hope that this information would incite investors, consumers, and even employees to ‘punish’ companies with high CEO pay ratios.
As with any position, in order to find the correct pay level, institutions need to compare against market data for similar positions within the same asset size, not against other positions.
While stirring up class envy and accumulating an abundance of likes on online articles, the real-time impact from those consumers, investors, or employees appears to add up to a failed experiment with laudable intentions. Interpreting the results across the board is impossible for many reasons, including vague exposition with endless ways to manipulate the data. Companies with lots of low-paying positions, sometimes caused by more branches, are going to look worse. The Act left it to the company’s discretion whether they wanted to compare only base pay or include variable pay, which makes it impossible to make any amount of true and accurate comparison between any two companies. Beyond this, it simply does not get to the heart of pay disparity, income inequality, or overall economic impact. A finance company that pays everyone well but preys on its customers can sometimes contribute more to economy-wide inequality than a multinational whose CEO earns exorbitantly more than its tens of thousands of employees. In contrast to expectations, Amazon reported a relatively low ratio of 59:1 despite the fact that its CEO is one of the richest men in the world. They were able to pad their ratio so low because their CEO’s investment returns, which compose the bulk of his earnings, are not part of his reported compensation, “which was a relatively modest $1.68 million.” This all shows that self-reported company salaries make for an entirely incomplete picture and do nothing for pay equity.
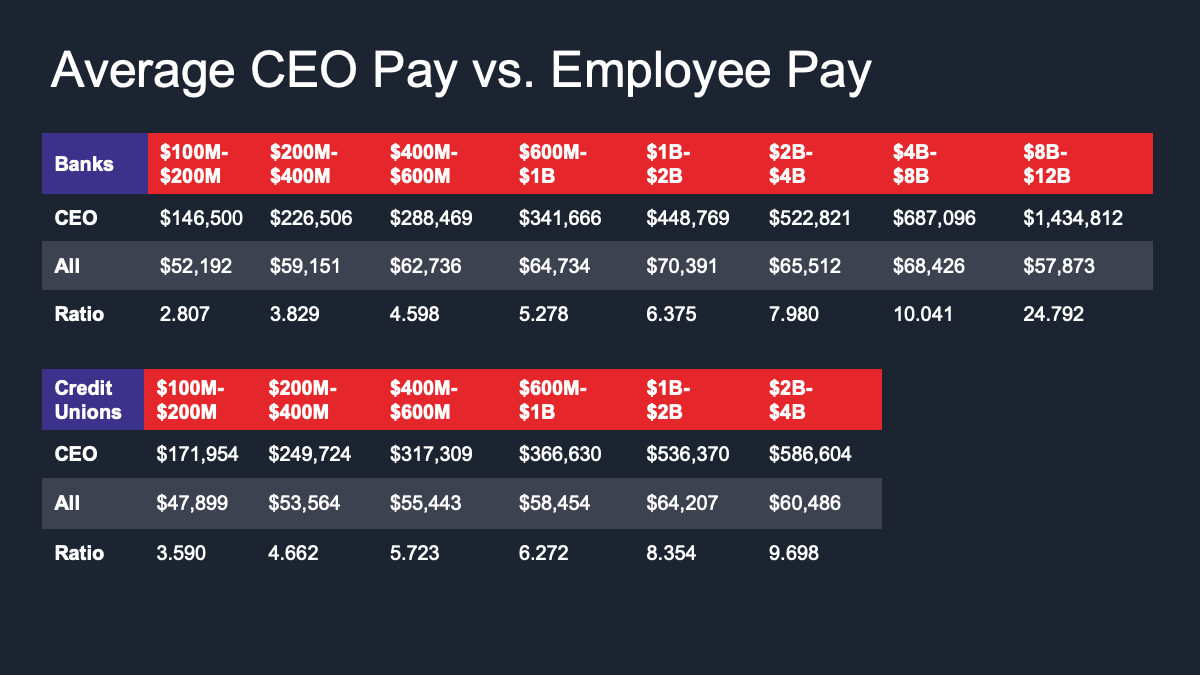
Finally, the data that really makes the headlines from large, publicly-traded companies has nothing to do with the reality of executive compensation at community banks and credit unions. Independent research amongst the 300 financial institutions that are BalancedComp clients show financial institution CEOs do not have pay ratios anywhere near that of CVS’s CEO (who has a pay ratio to the average worker of $458 to $1 in 2021). Below is a more complete picture of the BalancedComp analysis on average CEO pay ratios for credit unions and banks nationwide. This data was effective June 2022.
As with any position, in order to find the correct pay level, institutions need to compare against market data for similar positions within the same asset size, not against other positions.
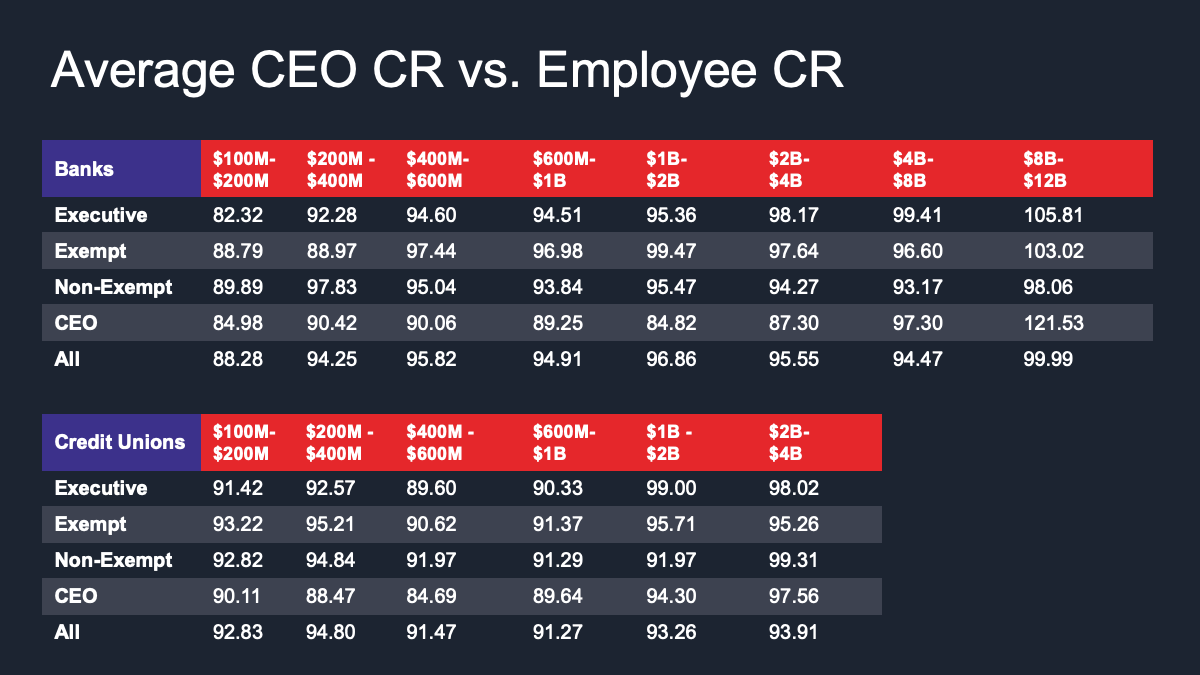
If your CEO’s compensation level on base and variable pay is equitable to the market, they are justified. Are CEOs of credit unions and banks overpaid? “Not systemically,” says Jordan Summervill, Compensation Manager at the boutique compensation consultancy that focuses exclusively on financial institutions. “When comparing how close they are paid to market on base pay as a percentage, CEOs are paid lower in their salary range than exempt and non-exempt job classifications. Considering that in 2022, they had an average of 9 years in their role, that is substantially less. The average salary structure movement at the CEO level for these asset categories has been an annualized 2.64%.”
Pay Equity is something all companies should focus on, but being myopic with a CEO Pay ratio will never fix that problem. Comparing jobs at all levels to market data to determine the correct “market rate,” adjusting for your city and state, and considering an incumbent’s time and performance in the role regardless of race, religion, or gender is how pay inequity is truly resolved.
Back to Blog