

By Christie Summervill

A 3.5% to 3.8% labor budget will cover most of your organization in 2027. It will not cover the jobs that are actually moving. Teller hire rates have been outrunning typical market movement. Technology and AI roles still command a premium. A wave of CEO, CFO, and Chief Credit Officer retirements is putting a price on leaders who can do the next job, not the last one. Unemployment at 4.1% and CPI at 3.4% make the market look settled. It is not.
Teller pay has been rising faster than typical market-rate movement, though the gap is narrowing. The pressure is concentrated at the hire rate, not across the whole range. Three forces are at work.
- Large-bank floors. Bank of America raised its minimum to $25 an hour in 2025, up from about $15 in 2017. BNY and several large credit unions have matched it or come close. At full-time hours, that is a salary above $50,000. It pulls community bank and credit union hire rates up in contested labor markets, even for institutions that never intend to match dollar for dollar.
- Turnover and competing employers. Tellers are hard to hire and hard to keep. Pathstream reports that 60% of retail branch tellers leave within a year, and banks take 40 to 45 days to fill each vacancy. Both figures came from a session at CBA LIVE 2025.
- Job redesign. Many institutions are combining teller roles with MSR and universal banker roles and paying for the broader job. In many structures, this moves the job up a grade, such as from grade 5 to grade 6, when MSR work makes up 35% or more of it. In other cases, tellers are simply trained as backup, and the grade may not change. Either way, it can look like a higher starting wage in survey data, even when headcount is shrinking.
Teller supervisors also made the strong-growth list in the BalancedComp 2025-2026 Salary & Incentive Survey. That is the natural next step when hire rates rise and institutions blend tellers into universal bankers and MSRs.
At the other end of the job architecture, senior leaders are retiring, and competition for experienced replacements is intensifying. Organizations that don’t want to promote first-time executives into the C-suite will have to pay up to recruit. Others want new leadership altogether. Either way, many C-suites and their benches were built for a different era, one that rewarded operational excellence, functional depth, and incremental change.
More than half of credit union CEOs are expected to retire or transition within the next six years, and nearly a third are already over 60. Banks hire outside more often because the next job needs M&A, commercial, digital, or turnaround experience the internal bench often lacks. In the 2026 Bank Director compensation and talent survey, the biggest development gaps for heirs apparent were M&A experience (45%), strategic acumen (41%), people leadership (31%), and regulator credibility (31%). Only 57% of boards with a named candidate think that person could step in tomorrow.
Whether it’s starting pay on the teller line, scarce technology and AI talent, or the cost of replacing senior leaders, a contained unemployment rate and 3.4% CPI should not lull anyone into thinking the average labor budget is enough. That average, projected at 3.5% to 3.8%, describes the middle of the market, not the jobs that are moving. Budgeting to the average will fund the typical employee. It will not fund the positions that determine whether you can staff the branch, modernize your technology, or hand the institution to the next CEO without a scramble. Many other specialty positions sit between the teller line and the C-suite, too.
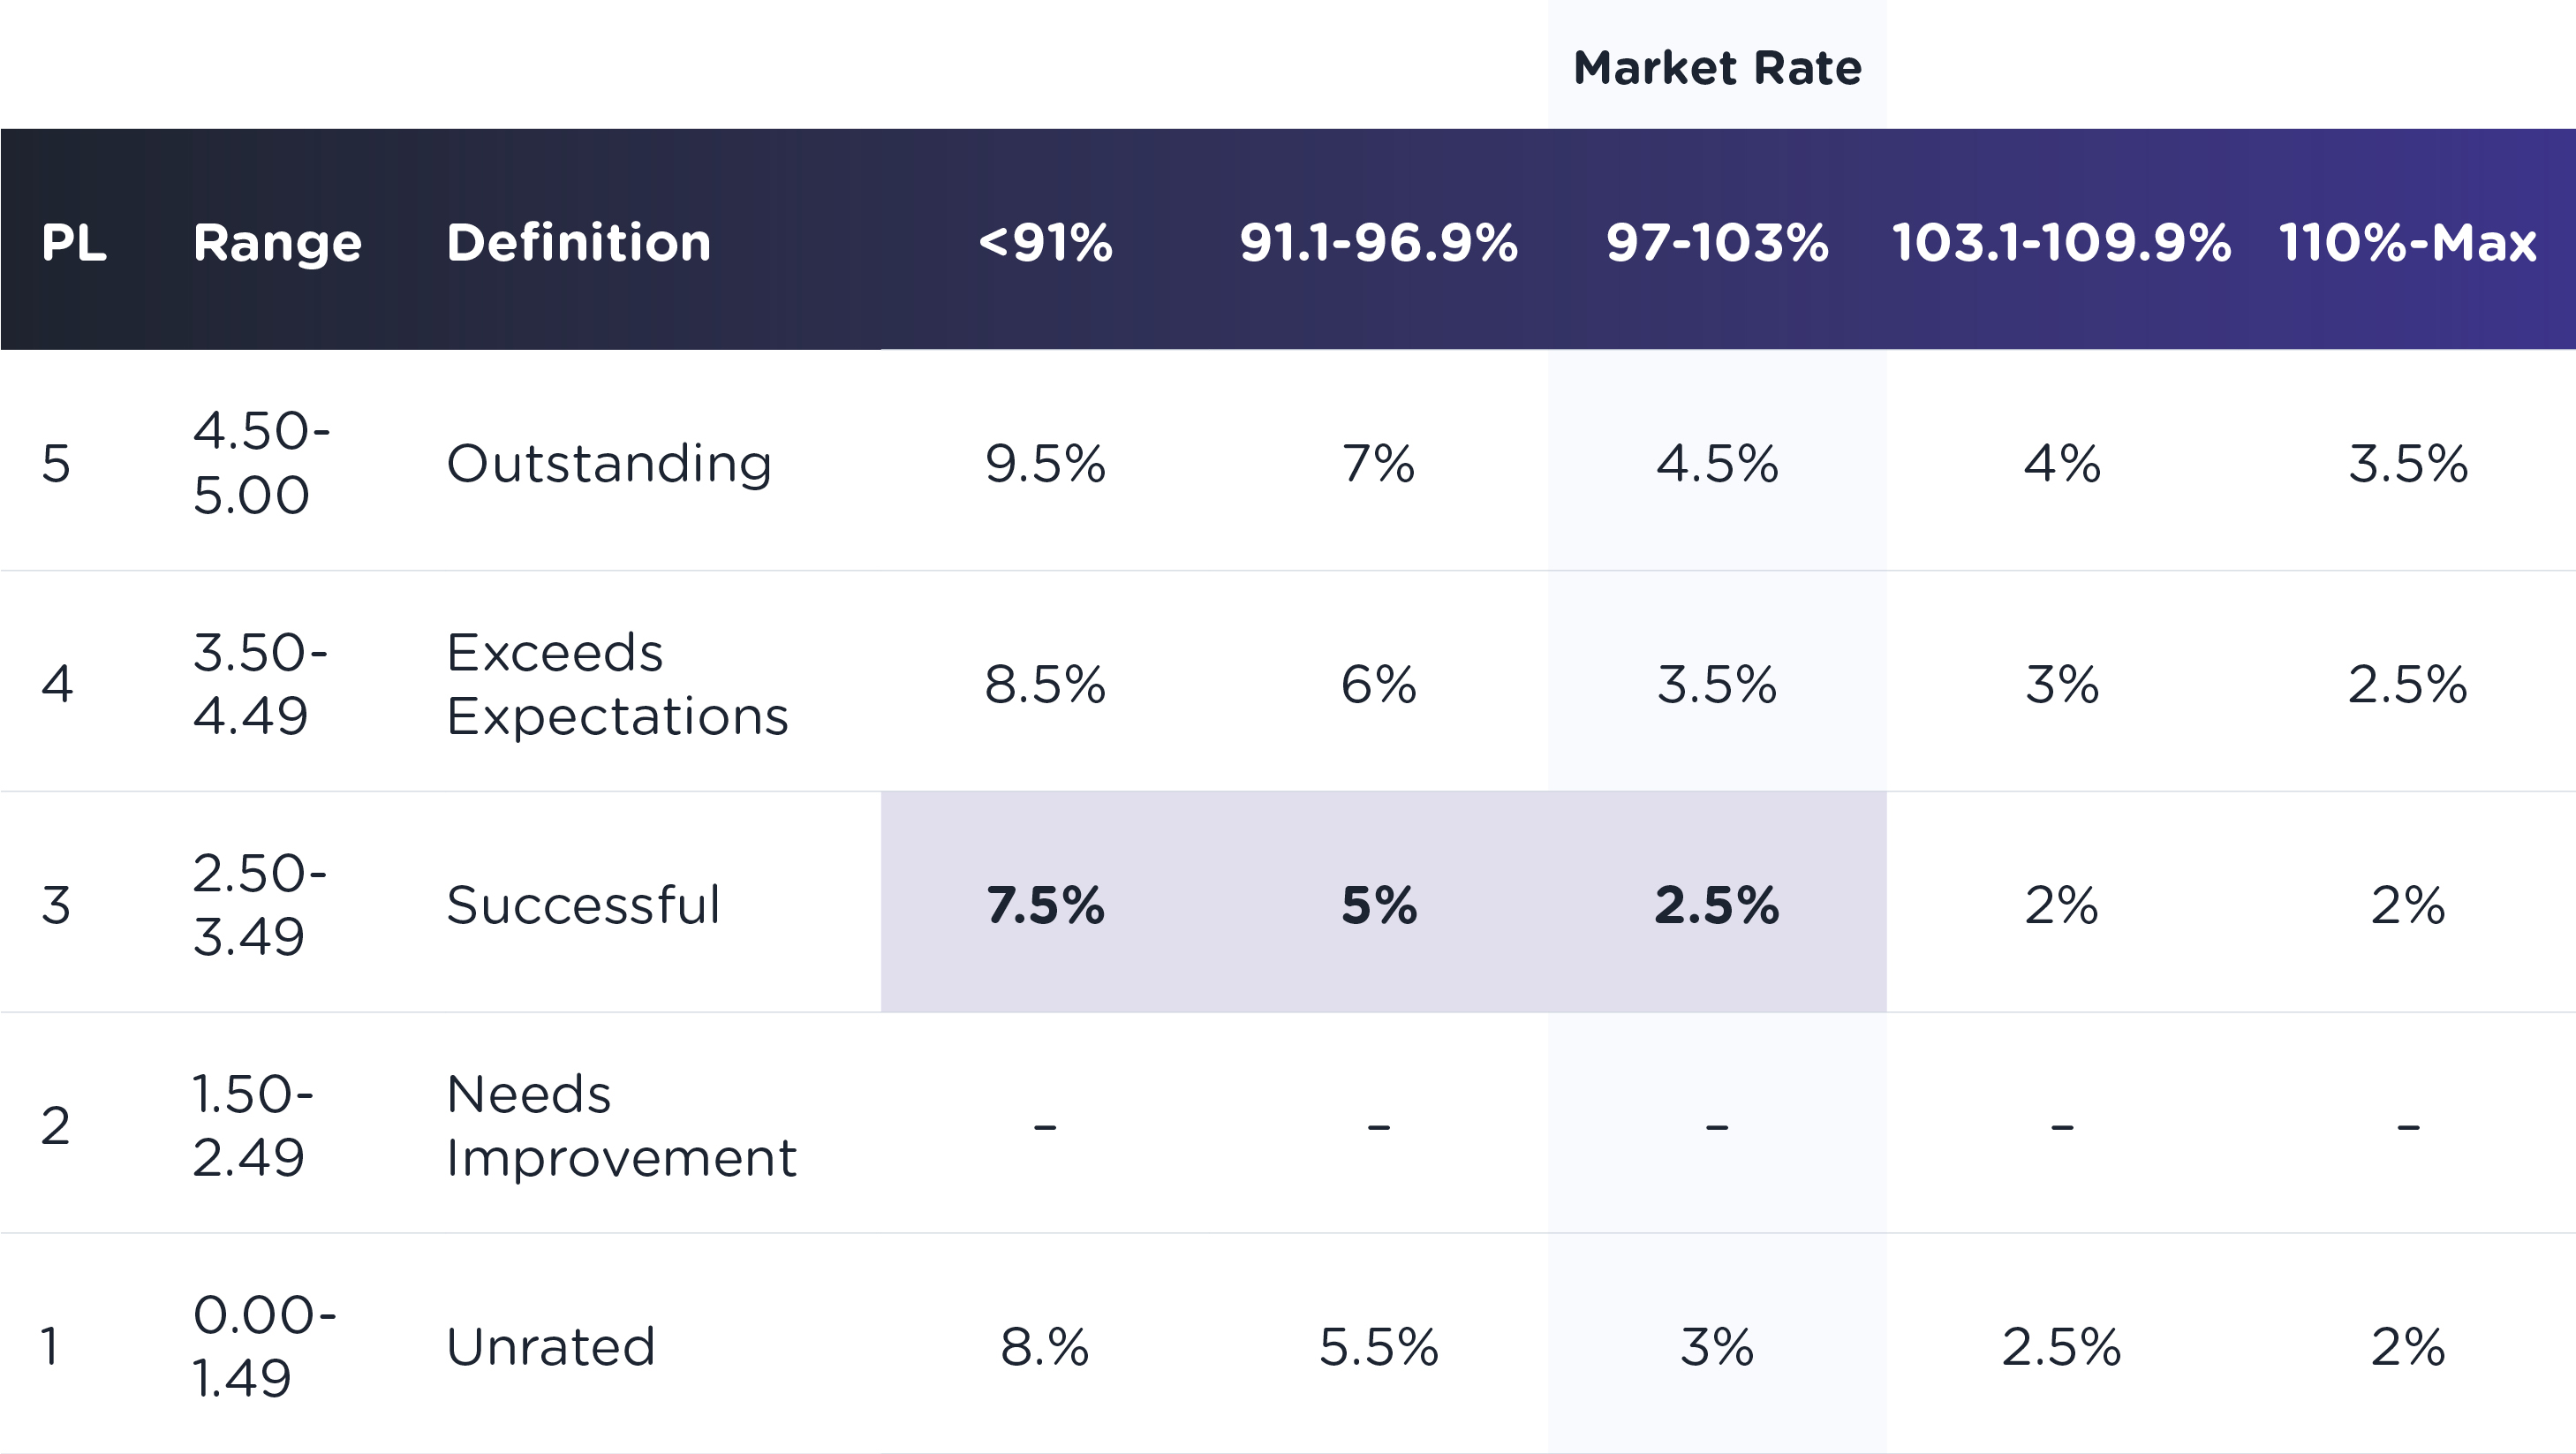
When you build your labor budget matrix, start with the point where “Meets expectations” intersects with a market rate compa-ratio of 97% to 103%. In 2027, that number is projected to be 3.0%.
Next, decide how much more your top-rated performers should receive than your “Meets expectations” performers. Ideally, your performance classes differ by at least 2%. That difference moves higher performers toward the midpoint faster and makes them less likely to start browsing job sites.
The math gets tight. A 3.5% to 3.8% labor budget leaves only 0.5% to 0.9% after funding the 3.0% midpoint movement. That is not enough to pay for performance and correct the jobs that are behind. We recommend holding at least 1% for those two things.
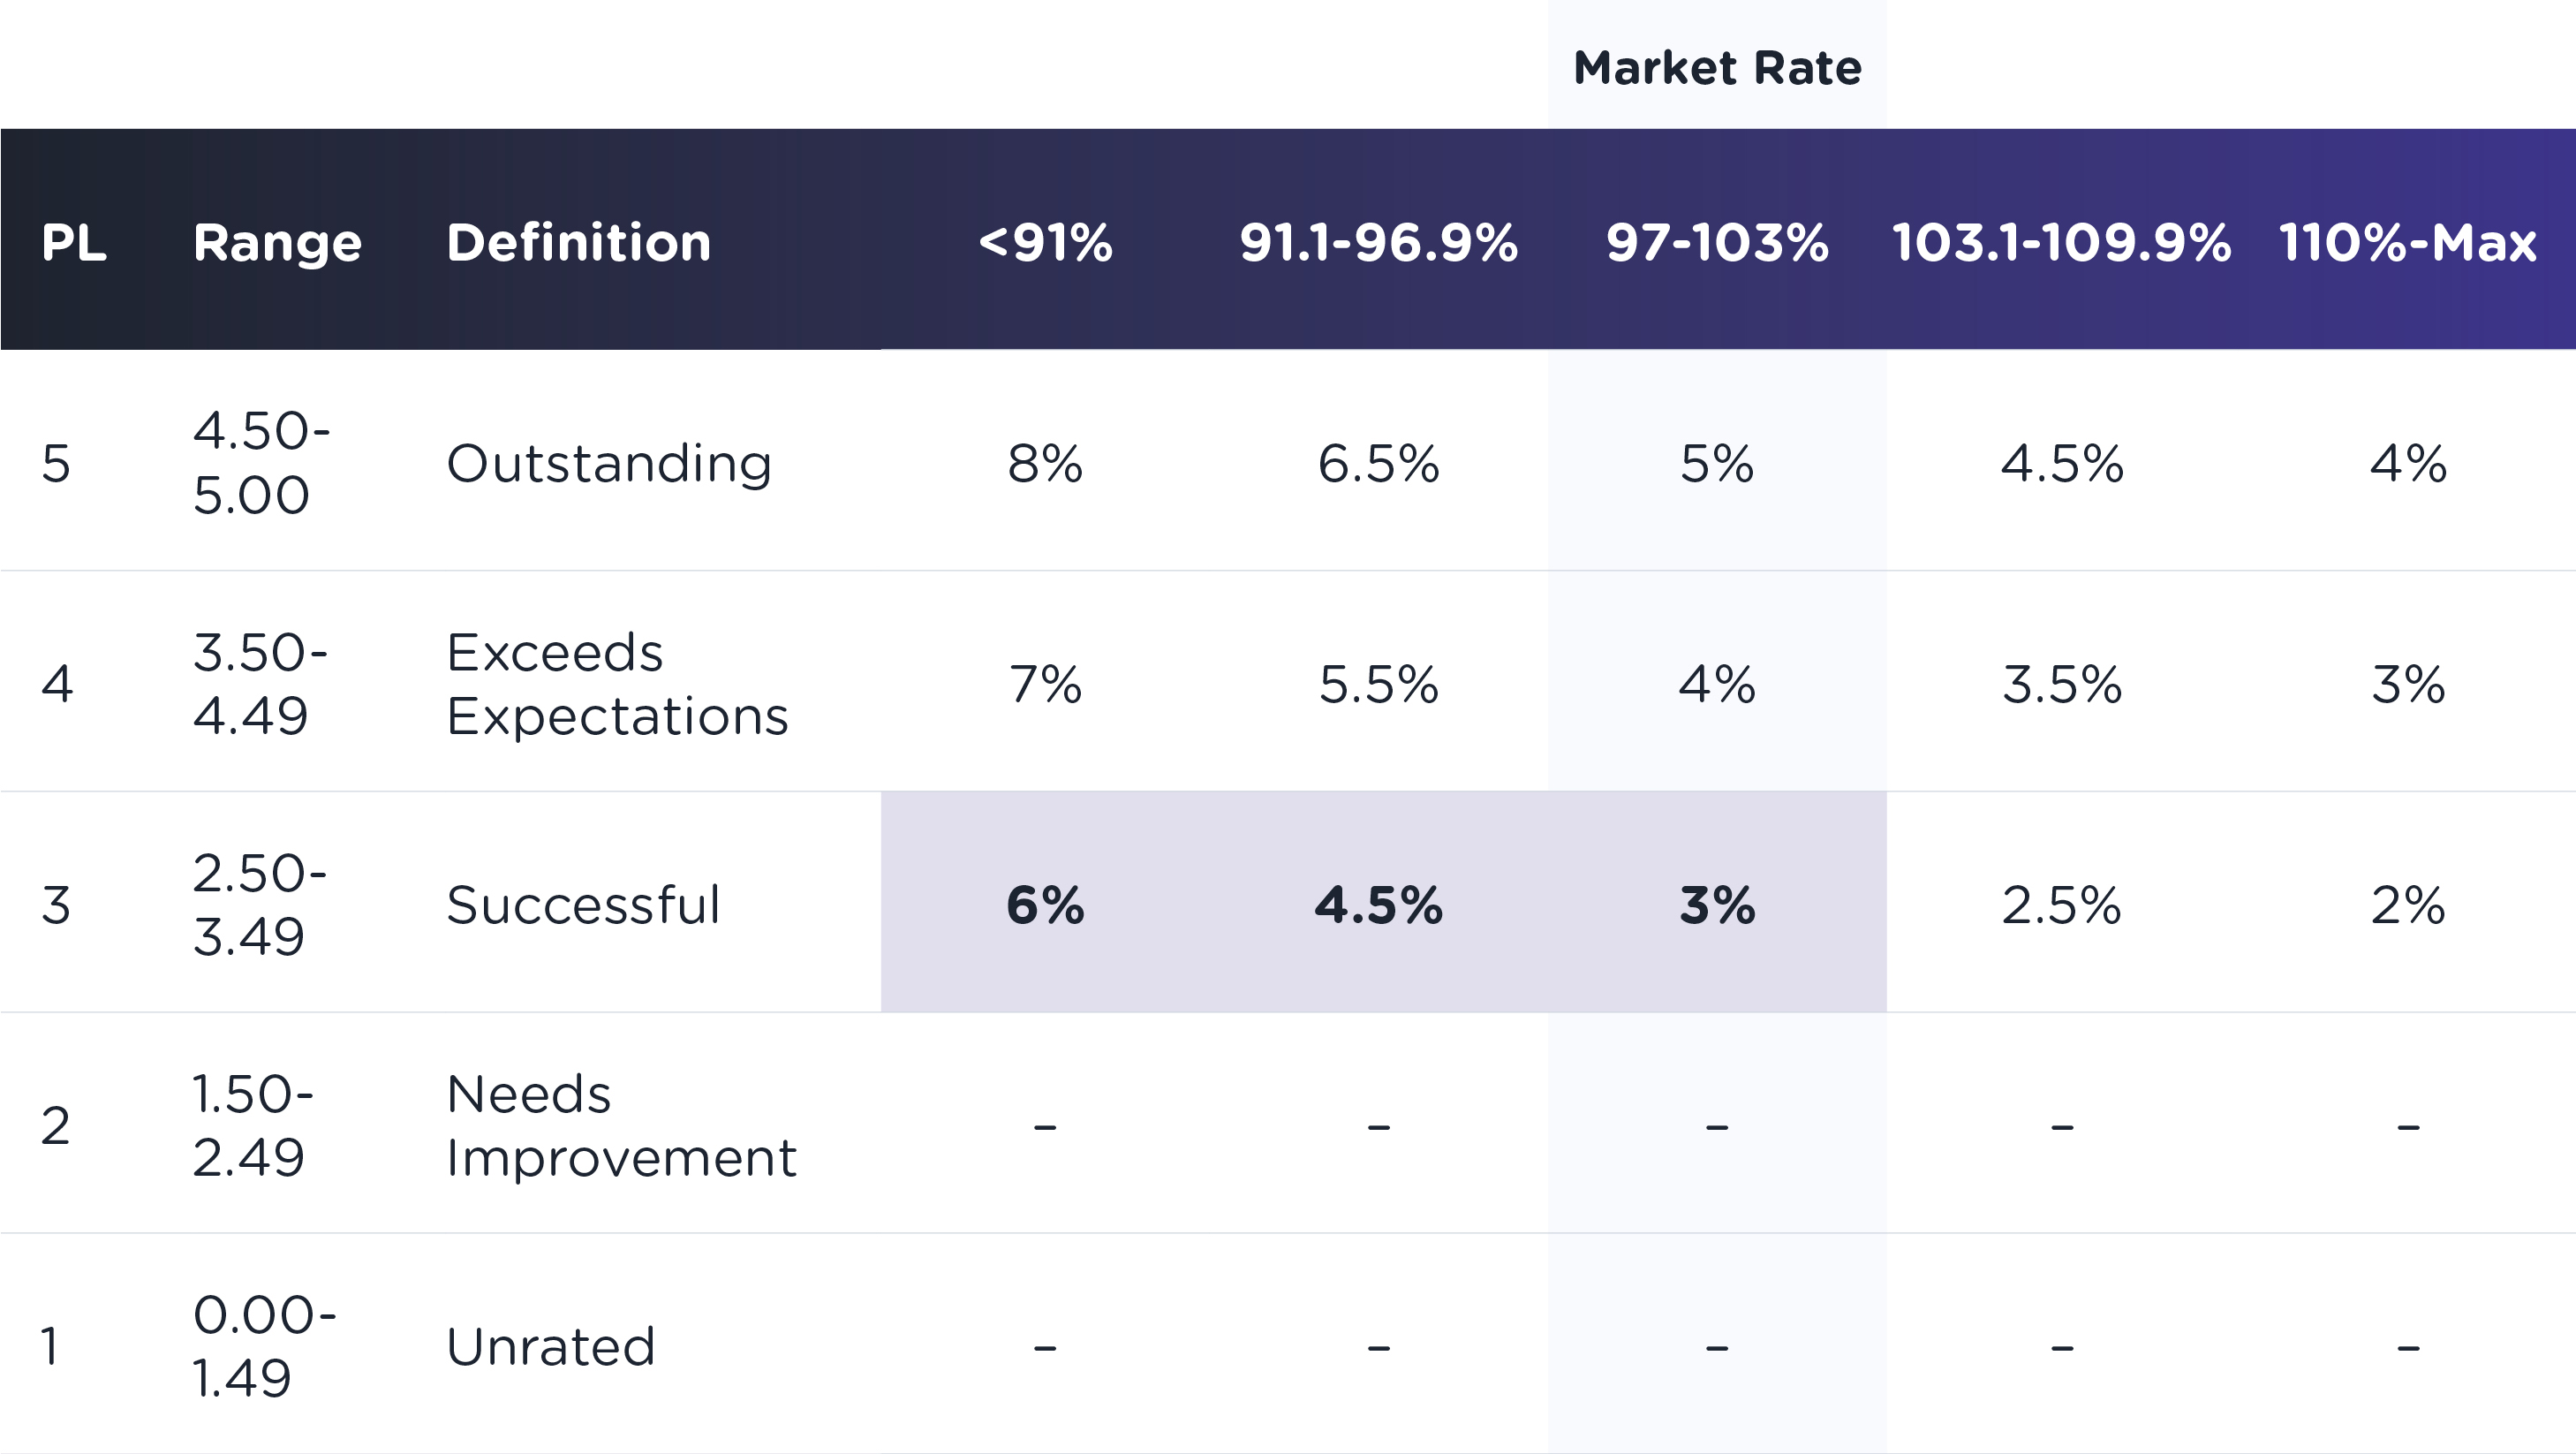
New hires need a plan too. If a non-exempt employee is new to the company or new to the position through an internal move, their compa-ratio should start at 85%. The same applies to executive starting pay when the institution has recently moved its peer group into a larger asset size. Starting at 80% of midpoint says, “Our starting pay is at a level that fewer than 10% of our competitors would pay.” To reach market rate within three years in a regular market, new hires need an additional 5% on top of the 3.0% (see Matrix A). Exempt employees should reach the midpoint within five years, with market movement set at 3.0% year over year (see Matrix B).
Matrix A
Matrix B
Hot jobs, where salaries are moving twice as fast as the market, may need a 10% premium added to their midpoint before you run your budget. That is preferable to over-grading. The fastest-moving salaries in the BalancedComp 2025-2026 Salary & Incentive Survey include some usual suspects: CEO, COO, director of internal audit, director of marketing, and head of retail banking. There were surprises too, including BSA officer, HR specialist, teller supervisor, and ACH specialist. See the full list in our article on the 30 fastest-growing salaries for financial institutions in 2026.
A family-friendly workplace and competitive health and retirement benefits are the price of admission. On their own, they will not hold the people who move results. The institutions that stay ahead keep correcting salaries so pay reaches the midpoint in a reasonable period of time, even in a difficult rate environment.
That is the work the matrix is for: fund the middle of the book at 3.0%, then spend the rest of the 3.5% to 3.8% where the market, the hire rate, and the next leader actually are.
BalancedComp makes this process easier. Our compensation management software draws on 30+ national data sources, tailored to your asset size and location, and our HR consultants help you build a pay-for-performance culture grounded in market data. Schedule a demo to see how it works.
Back to Blog